Has the dollar been the dominant international currency because of an absence of alternatives?
Table of Contents
- Dollar supreme skeptics
- Why has the dollar remained pre-eminent over emerging alternatives?
- Figure 1 shows the currency composition of foreign exchange reserves
- 1. Growing liquidity of markets in those currencies nontraditional reserve currencies
- The “Big Four” effect
- 2. Central bank reserve managers have become more active in chasing returns
- 3. Yields on bonds issued by the governments of the Big Four countries were falling to effectively zero
- Rise of Nontraditional Reserve Currencies
- What are the nontraditional reserve currencies
- Countries driving the trend towards nontraditional reserve currencies
- Assortment of other factors
- BRICS
Dollar supreme skeptics
This post is part of a larger effort in which I have tried to chip away at some of the most persistent ‘dollar deniers’ – an ad hoc movement of people who envisage a multiple-currency international monetary and reserve system.
In this post I’ll wander into strong agreement with their better informed and imaginative brethren who point to the declining importance of network effects and the broad changes in market technology that have reduced the cost and increase the ease of transacting in nontraditional international currencies.
NOTES:
- this post will use charts and information that cuts off at 2021/2022, this is because there is incomplete reliable data for the period after.
- Of course the situation with the war between Russia and Ukraine and sanctions have caused changes, but there’s an unknown as to sustained effects.
- I have used data from the reports and graphs that came from the Bank of International Settlements, SWIFT and the IMF and have linked to those sources with attributions
Why has the dollar remained pre-eminent over emerging alternatives?
So many reasons, but as this post is narrowly about the reallocation of central bank holdings, I’ll hover above my target:
- Other currencies suffer from an inadequate supply of investment-grade government securities for investors to hold as safe assets and central banks to accumulate as reserves. And/or,
- Liquidity and availability is limited by regulation, including capital controls. And/or
- They do not benefit from the large installed base of transactions denominated in dollars. They therefore lack the complementarities and synergies of different cross-border uses benefiting the dollar.
Figure 1 shows the currency composition of foreign exchange reserves
According to the IMF’s Currency Composition of Official Foreign Exchange Reserves (COFER) survey.
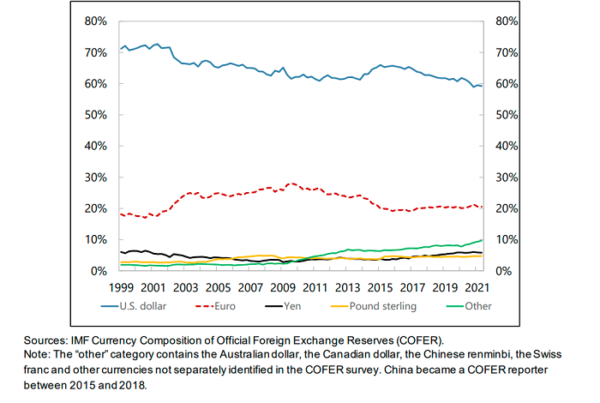
The share of reserves held in U.S. dollars by central banks has dropped by 12 percentage points, from 71% in 1999 to 59% in 2021.
Question: Is the decline a byproduct of changes in exchange rates, interest rate levels, or interest rate differentials?
Answer: No:
- Reserve managers tend to rebalance their portfolios, restoring prior currency shares, to offset such changes.
- The decline is not the result of reserve accumulation by a small number of large reserve holders with a preference for non-dollar currencies.
- Nor is it a figment of changes in country or currency coverage of surveys of reserve composition.
Rather, this change reflects portfolio diversification by central bank reserve managers.
Figure 1 (above) showed that the decline in the dollar’s share is not a shift toward the euro, the British pound sterling and the Japanese yen, the currencies that have historically played a significant international role and, along with the dollar, that have comprised the basket making up the IMF Special Drawing Rights.
(The SDR is an international reserve asset created by the IMF to supplement the official reserves of its member countries. The SDR is not a currency. It is a potential claim on the freely usable currencies of IMF members.)
Though there was a rise in the share of reserves in euros after 2000, this increase was not sustained. The decline in the dollar’s share has been matched by a rise in the share of what is called ‘nontraditional reserve currencies’, these are currencies other than the US dollar, euro, Japanese yen and British pound sterling.
As shown in Figure 1, the share of nontraditional reserve currencies rose from negligible levels in 2000 to roughly $1.2 trillion and 10% of total identified reserves in 2021.
Using data from the IMF’s Special Data Dissemination Standard (SDDS) and national sources, you can see that the shift away from the dollar has been slight, only about 25% of the shift has been into the Chinese renminbi, but fully 75% has been allocated into other nontraditional reserve currencies.
The shift out of dollars is more substantially a shift into the currencies of smaller economies that, historically, had less of the scale and liquidity needed to constitute an attractive form of international reserves.
This shift into nontraditional reserve currencies is broad based. There are 46 “active diversifiers,” these are countries with a share of official reserves in nontraditional currencies of at least 5% at the end of 2020.
Three factors contribute to the growing footprint of nontraditional reserve currencies.
1. Growing liquidity of markets in those currencies nontraditional reserve currencies
Historically, only a handful of countries had deep and liquid markets in domestic-currency assets open to the rest of the world. Foreign exchange dealers were able to find counterparties only in that same handful of currencies, quoted and transacted in a limited number of bilateral exchange rates. The principal currencies traded in the foreign exchange markets of developing countries in the year 2000 was the dollar, euro, pound sterling, and Japanese yen (called the “Big Four”).
The “Big Four” effect
As an example:
- The cheapest way of purchasing Canadian dollars with Mexican pesos was by first purchasing U.S. dollars with Mexican pesos and then using the U.S. dollars to purchase Canadian dollars, reflecting the high liquidity and low transactions costs of markets for U.S. dollars.
But, as transactions costs have fallen with the advent of electronic trading platforms, now using automated market-making (AMM) and automated liquidity management (ALM) technologies for foreign exchange transactions, the savings associated with transacting in U.S. dollars are less.
Meanwhile, a growing number of countries have developed markets for trading currencies other than the Big Four. In addition, the expanding global network of central bank currency swap lines has enhanced the ability of central banks to access currencies other than the ones they hold as reserves, weakening these links across markets and functions.
2. Central bank reserve managers have become more active in chasing returns
Central banks have accumulated substantial portfolios of financial assets. The larger the portfolio, the more scope there is for financial gains (and losses) from active reserve management.
When reserves exceed the level associated with reserve adequacy, reserve managers come to distinguish different reserve tranches:
- The minimum required for reserve adequacy (the “liquidity tranche”), which should be held in liquid, low-risk assets. The liquidity tranche is used to finance ongoing deficits, service and redeem debt, and intervene in the foreign exchange market, and as such tends to be held in the same relatively liquid assets denominated in the same currencies against which intervention is conducted.
- And the rest (the “investment tranche”), which can be more actively managed, with returns in mind, and invested in less liquid assets. The investment tranche can be placed in nontraditional instruments and currencies. As the investment tranche grows relative to the liquidity tranche, one should expect to see more diversification in this direction.
3. Yields on bonds issued by the governments of the Big Four countries were falling to effectively zero
this led central bank reserve managers to intensify their search for higher yielding alternatives.
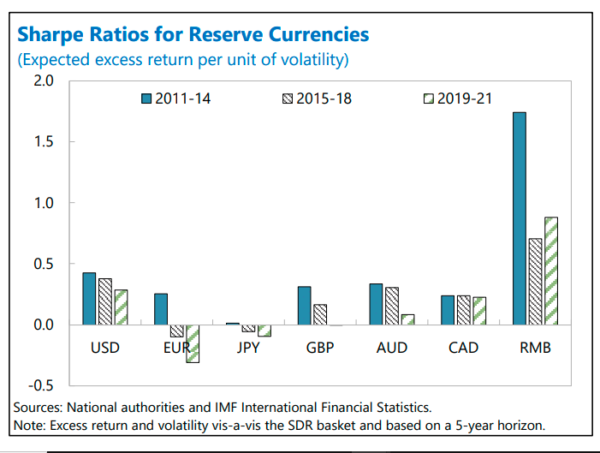
The effect can be observed in the Sharpe Ratios (returns adjusted for volatility) which have been more attractive for nontraditional currencies than the Big Four at a variety of points in the last decade.
Rise of Nontraditional Reserve Currencies
Global holdings of nontraditional reserve currencies have risen from negligible levels (about US$30 billion in 1999) to US$1.2 trillion in the last two decades. Currency Composition of Official Foreign Exchange Reserves (COFER) data sheds light on the timing.
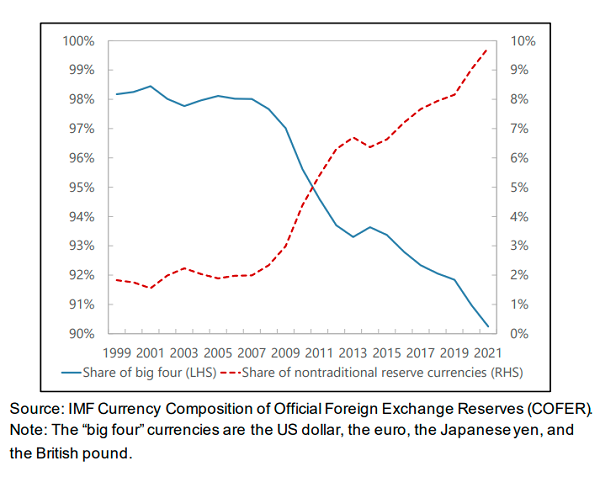
Figure 2 compares the share of official reserves denominated in one of the “Big Four” leading reserve currencies (the US dollar, the euro, the British pound, and the Japanese yen) with the share denominated in nontraditional currencies, over the period from 1999 to 2021.
Figure 2. Official Reserve Shares of “Big Four” Currencies vs. Nontraditional Currencies
Will Central banks increase those holdings as a hedge against high energy and commodity prices? I don’t know, but buckle up for wars.
The share of the traditional reserve currencies in global reserves has declined over the period, mirrored by a rising share of nontraditional currencies, which now stand at roughly 10% of global reserves. In particular, there was a shift in reserve composition after 2008, during which reserve managers diversified away from the Big Four currencies relatively quickly, followed by a steadier downward trend in these subsequently.
What are the nontraditional reserve currencies
These are defined as any currency other than the Big Four.
COFER (Currency Composition of Official Foreign Exchange Reserves) provides data on reserves held in the Australian Dollar, Canadian Dollar, Chinese Renminbi, and Swiss Franc, which together constitute 71% of the nontraditional currency total as of end-2020.
Estimates indicate that the remaining 29% is comprised of:
- three European currencies: Swedish Krona, Norwegian Krone, Danish Krone, and;
- four Asian currencies: Korean Won, Singapore Dollar, New Zealand Dollar, and Hong Kong Dollar.
Countries driving the trend towards nontraditional reserve currencies
Data from the IMF Reserve Data Template covers more than 80 countries representing over 90% of global foreign exchange reserves as of end-2020 and breakdown the composition of each economy’s official reserves into currencies included in the IMF’s Special Drawing Rights (SDR) basket (currently the Big Four and the Chinese renminbi), and currencies not included in the basket.
Figure 3 displays the currency composition of reserves for 46 countries that can be classified as “active diversifiers,” defined as countries with more than 5% of their FX reserves denominated in the renminbi and non-SDR currencies as of the latest available period (generally end-2020).
Figure 3: Foreign Exchange Reserves in Nontraditional Currencies, end-2020
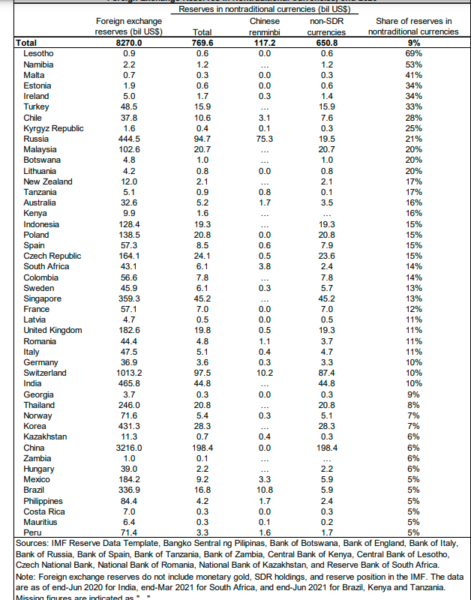
The trend toward diversification is evenly split between emerging and advanced economies. At the same time, a number of countries stand out as being especially active diversifiers.
- China is the largest holder of nontraditional currencies
- Switzerland is next with with $97 billion
- Russia is third with $94 billion.
Changes for other countries may be explained by their trade and financial links with nontraditional reserve currency issuers.
- Namibia holds a large share of its reserves in South African rand due to its peg to that currency and trade relations with South Africa.
- Kazakhstan and Kyrgyz Republic hold Russian rubles due to their close trade relationships with Russia.
The motivations of some other central banks are less obvious. For example, Estonia holds Australian dollars (AUD) and Canadian dollars (CAD) according to the Central Bank of Estonia.
One explanation for this broad shift toward nontraditional reserve currencies is that financial technology and market conditions have enhanced the attractions of smaller currencies, they’ve become more liquid and therefore more attractive as reserves.
Figure 4 shows average bid/ask spreads against the dollar for three traditional and three nontraditional reserve currencies
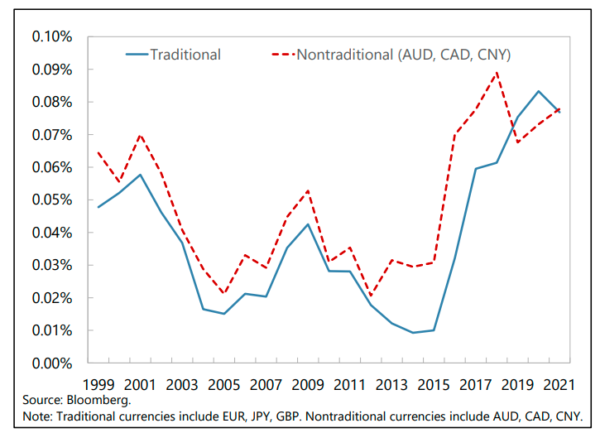
- In most periods, the spread between the two series is small.
- In the recent period (ending in 2021) spreads on nontraditional currencies have actually been lower than those on their traditional counterparts.
- The period which has a sharp increase in bid-ask spreads, such as 2013-2015, may be explained partly by a reduction in overall liquidity due to the implementation of banking regulation after the global financial crisis.
There is also persistent arbitrage opportunities in foreign exchange forward and swap markets and provide evidence that constraints on bank balance sheets due to financial regulations explain part of this development.
Another part of the explanation has to do with changes in reserve management practice.
Central banks have attached more weight to mean-variance optimization and less to liquidity in an environment of low yields.
In that environment, nontraditional currencies that have higher Sharpe Ratios (higher expected excess return per unit of volatility) could improve the risk-return tradeoff in a portfolio with only traditional reserve currencies.
Figure 4 shows excess returns and volatility vis-à-vis the SDR basket and is calculated over a 5-year horizon – the preferred habitat of most reserve managers within the yield curve. It confirms that the Australian dollar, Canadian dollar, and the Chinese renminbi have had higher Sharpe ratios than the euro, the yen and the pound.
This reflects the decline in interest rates in the principal advanced economies over the last decade (the phenomenon known as “secular stagnation”), higher yields in other economies not as immediately affected by these same tendencies, and in the case of the renminbi the limited volatility of a heavily managed currency.
Assortment of other factors
This post has been about a move to alternative reserve currencies and a trend that reduces central bank dollar holdings, but in closing I don’t want to neglect all the intricacies of other operations that affect holdings, so I’ll include a few here just for the sake of some completeness.
Large Reserve Holder Effects
A non-trivial component of the increase in reserves allocated to currencies other than the dollar could conceivably be due to the actions of Swiss National Bank (SNB), which holds an unusually low share of dollars.
Since the first quarter of 2000 the total FX reserves held by the SNB have grown from $28bn to $1.03 trillion at the end of 2021. However, this does not change the overall trend: the USD share excluding the SNB still falls from 72% to 61% between 1999 and 2020.
COFER Reporting Effects
Similarly, changes in the composition of the COFER (Currency Composition of Official Foreign Exchange Reserves) dataset could have contributed to the fall in the dollar share. The share of allocated reserve holdings (for which the currency breakdown is available) has increased significantly due to the inclusion of new reporting countries.
There is, in fact, a large increase in the share of allocated reserve holdings between 2015 and 2018, from 58.9 percent in Q1 2015 to 93.8 percent in Q4 2018, complicating historical comparisons.
The confidentiality of country data in the COFER survey prevents measuring the contribution of the new countries individually, although it is known that the 145 countries reporting as of end-2012 has since increased to 149.
The most notable change is the gradual inclusion of China between 2015 and 2018, which started to report a representative portfolio of foreign exchange reserve assets to COFER on a partial basis in September 2015 and announced that it would gradually increase the reported portfolio to full coverage within a period of around two to three years.
Exchange Rate Effects
An alternative hypothesis is that, apart from allocation decisions by reserve managers, the dollar share may also be driven by exchange rate changes.
Interest Rate Effects
This is another mechanism that could generate movements in the dollar share without active sales or purchases by reserve managers is a sustained interest rate differential between dollar and other reserve assets.
Since a large share of FX reserves is likely to be held in interest-bearing assets, such as deposits and government bonds, any differences in rates of return on different currencies would cause the shares to fluctuate (especially if interest income earned in a given currency is reinvested in assets of the same currency). Thus, we might observe a fall in the dollar share if dollar interest rates are lower than rates on other currencies. Relatedly, significant movements in reserve currency bond yields could lead to capital gains or losses and a change in currency shares.
BRICS
The intention of over twenty countries to join BRICS is the evidence of high political authority of the “group of five” which constantly upholds the formation of “a flexible, effective, efficient, representative, democratic and accountable international and multilateral system.”
This trend is closely associated with de-Westernization processes in societies and policies of global South countries and their growing pursuit of autonomy and freedom in determining their own policy and priorities (after 2020 and particularly in 2022).
Though BRICS has declared its intentions for reforming, rather than establishing an alternative global governance system, numerous countries regard BRICS as critical in the forefront of “de-Westernization.”
The decision on joining BRICS by the Arab Republic of Egypt, the Islamic Republic of Iran, the United Arab Emirates, the Kingdom of Saudi Arabia and the Federative Democratic Republic of Ethiopia has strengthened the share of GDP of the enlarged BRICS based on purchasing power parity is equal to 36.9% and the share of the population, to 46.7% of the global one (compared to the G7 countries’ 29.95%2 and 8.61%3, respectively). At the same time, the gap between the level of representativeness and the ability to influence decision-making in the IMF has widened.
Thus, even after the expansion, the BRICS collective share of quotas and votes in the IMF will be equal to 19.32% and 18.57%, respectively, compared to the collective G7 share of 43.36% and 41.4%, respectively.
Overall, this creates additional grounds for a more active position of BRICS on reforms and strengthening of the international financial architecture (IFA). And it concerns not only the Bretton Woods
institutions, but also all components of the existing system, including global and regional financial safety nets, sovereign borrowing and debt mechanisms, multilateral development banks, financial market regulation and the financial and payment infrastructure.
BRICS faces a serious task of integrating new members into existing cooperation mechanisms. Expansion will pose a challenge to the group’s internal unity. Added to territorial disputes and differences between China and India are the conflicts between Egypt and Ethiopia over water resources (the Blue Nile) and competition for intraregional influence between the countries of the Middle East.
It is necessary to define the parameters for new BRICS members’ accession to the New Development Bank (NDB), including the size of quotas and allocated capital and the nature of participation in the management of the bank, with taking into account the fact that according to Article 6a of the Agreement on the NDB the number of votes of a shareholder is equal to its share in the bank’s allocated capital.
At the same time, in accordance with Article 8c changes in the subscribed capital cannot lead to a decrease below 55% in the share of the founders of the bank and to an increase above 7% in the share of votes of a non-founder member.
It is obvious that new members will be claiming participation in the management of the bank, and a decision will have to be made regarding Article 13c under which each founding country is represented by at least one vice-president, except for a country represented by the president.
Enlargement is unlikely to make it easier for BRICS to agree on a single settlement unit within the group. For many years, the idea of creating a single BRICS currency has been debated at the expert and working level.
This issue was not reflected in official documents. At the same time, the BRICS countries have noted the need to use national currencies in trade and investment since 2015.
In 2023, Brazilian President Lula da Silva raised the issue of creating a single settlement unit to the political level. The Johannesburg summit emphasized the need to encourage the use of national currencies in international trade and financial transactions between the BRICS countries and their trading partners, as well as cooperation on
the payment infrastructure to facilitate trade and investment flows. The leaders instructed finance ministers and central bank governors of the BRICS countries to consider the use of national currencies, payment instruments and platforms and report on the results at the next summit.
A single currency is not mentioned in the order, probably, because of India’ opposition to this idea. However, there is still a chance that debates will begin on possibilities and practical steps to create a single BRICS settlement unit which would be instrumental in solving
the issue of bilateral trade surpluses in national currencies.

Specific proposals for the implementation of the idea, including the creation of an “issuing bank” and the provision of securities guaranteed by member countries, were formulated by Paulo Nogueira Batista, Brazilian economist and former NDB vice-president.
The settlement unit can be formed by analogy with the special drawing rights on the basis of a basket of national currencies, reflecting the relative economic weight of the member countries’ economies.
At the first stage, it could function as a digital unit of denomination for government transactions and official accounting, as well as for replacing the US Dollar in the NDB’s internal accounting and the Contingent
Reserve Arrangement. With a single settlement unit available, countries with a trade surplus would be able to use it in bilateral transactions with other member countries. The NDB could promote dedollarization by accelerating the use of the new settlement unit in its loans and other financial transactions, as well as in issuing of securities.
The implementation of the initiative could become an important contribution of BRICS to the reform and democratization of the international financial system. It undoubtedly meets Russia’s priorities in ensuring economic security, economic sovereignty, sustainable economic growth and a higher international competitiveness of the national economy.
Probably, at the first stage not all BRICS members would like or be able to join the mechanism. One should be prepared that this movement will take place at different speeds. Given the commitment of Brazil’s leaders to this idea, there is a chance of launching the mechanism in the
next two years.
BRICS has entered a new stage of development and its efficiency
will depend in particular on the quality of cooperation within the framework of Russia’s BRICS chairmanship in 2024.
And so on and so on.
The End?