
This post will peel back the Biden 1 trillion dollar infrastructure onion. We will start here and work our way backwards. Watch this…
Crazy, eh?
Now let’s begin by doing a post mortem on the last big bucks infrastructure bill
Prolog
Obama is President:
January 7, 2009: “Picture a sweaty brow, rolled-up sleeves, knotty forearms, calloused hands. Picture virgin land, just waiting to be transformed. Shovel-ready land. This is America on the eve of the Obama era” – Washington Post, January 2009
January 9, 2009: “U.S. employers shed 524,000 jobs in December…job losses brought the total for 2008 to 2.6 million…The unemployment rate jumped to 7.2 percent in December” – NY Times
January 9 2009: President Obama’s Advisers Predict The Stimulus Would Lower Unemployment To 5.3%
Chapter 1: Infrastructure and the bill: American Recovery and Reinvestment
February 17, 2009: President Obama signs the $800+ billion stimulus plan called American Recovery and Reinvestment Act of 2009 – ARRA
- $381 billion in federal tax cuts
- $98 billion dedicated to transportation and infrastructure spending: largely allocated to Renewable Energy projects
- $318 billion in transfers to state and local governments for range such as K-12 Education and Higher Education, preserving teaching obs and incentives for job retention, Medicaid, Health and Human Services, Unemployment Benefits and Corrections for underfunded programs
Transparency & Accountability Provisions:
ARRA includes provisions for transparency and accountability for all funds made available by the law. Information on expenditures from stimulus funding and implementations were public thru several agencies and websites.
Title XV, Subtitle A (P.L. 111-5) – Sec.1512 Report on the Use of Funds
c) Recipient Reports- Not later than 10 days after the end of each calendar quarter, each recipient that received recovery funds from a Federal agency shall submit a report to that agency that contains:
-
the total amount of recovery funds received from that agency;
-
the amount of recovery funds received that were expended or obligated to projects or activities; and
-
a detailed list of all projects or activities for which recovery funds were expended or obligated, including:
-
the name of the project or activity;
-
a description of the project or activity;
-
an evaluation of the completion status of the project or activity;
-
an estimate of the number of jobs created and the number of jobs retained by the project or activity; and
-
for infrastructure investments made by State and local governments, the purpose, total cost, and rationale of the agency for funding the infrastructure investment with funds made available under this Act, and name of the person to contact at the agency if there are concerns with the infrastructure investment.
-
Additional Financial Reporting (ACF-696 & ACF-696T)
As part of the efforts to ensure transparency and accountability, the ARRA requires Federal agencies and grantees to track and report separately on expenditures from funds made available by the stimulus bill.
We are going to be doing a post mortem on the 2009 The American Recovery and Reinvestment Act (ARRA) , an incredibly expensive test tube experiment.
It had some successes, just as if I buy $900 billion dollars on lottery tickets I will have some winning tickets, but I am going to tell you about the tickets that didn’t win.
ARRA died and now we are looking for its cause of death.
It’s complex and there are a host of comorbidities, which was the last straw? I dunno.
One incredibly expensive lesson is that delays between appropriations and actual outlays are deadly. It’s a leading cause of fiscal stimulation death.
The American Recovery and Reinvestment Act (ARRA) was signed in February of 2009, but the cumulative spending did not approach 100% of appropriations until the end of June 2012. Maybe its problems started there, it takes time to spend money and it takes time to build things. Somewhere in between those milestones is corruption, politics, cronyism, and a host of comorbidities.
And so on
Chapter 2: Infrastructure and shovel ready nothingness
February 17, 2009, day of bill signing “As part of the government spending, they wanted to have all those shovel-ready projects so that the money could be spent as quickly as possible. And the administration has promised that 75% of it will be spent in the next 18 months.” – NPR
March 4, 2009: “The Obama administration has said that the economic stimulus plan will immediately target construction and repair projects that are “shovel ready,” investing directly in the nation’s roads, bridges, schools and hospitals” – ABC news
In 2009, As President Obama was urging Congress to pass the $800 billion-plus stimulus package, one of his favorite selling points was that thousands of projects nationwide that he called “shovel ready” — by his definition at that time meaning planning is complete, approvals are secured and people could be put to work right away once funding is in place.
The media was already in high voltage propaganda as it promoted the Auto Bailouts, Bank Bailouts and ObamaCare, was grounding Americans into debt submission.
This is how “news” discussed the 2009 stimulus package.
Washington Post, January 2009:
- “Obama Brings ‘Shovel-Ready’ Talk Into Mainstream” “Picture a sweaty brow, rolled-up sleeves, knotty forearms, calloused hands. Picture virgin land, just waiting to be transformed….Shovel-ready land…This is America on the eve of the Obama era….Shovel-ready”
And this is Obama himself delivered his message, at a December 2009 Obama gave a speech at think tank Brookings
Obama: “Already, more than 10,000 of these [infrastructure] projects have been funded through the Recovery Act. And by design, Recovery Act work on roads, bridges, water systems, Superfund sites, broadband networks, and clean energy projects will all be ramping up in the months ahead”
But there is a gulf between his pitch and the taxpayer catch:
The reality: it’s true that 10,000 infrastructure projects had been “funded,” But…
- “Funded” is not the same thing as “underway”
- $31 billion in stimulus funds had only been made “available” as of November 27. Of that number only $6 billion had actually been paid out, more than eight months after Obama signed the stimulus measure
- “Shovel ready” means nothing and has no definition. “Ready to go” is the term used within the relevant agencies and means that a state has already done preliminary work for a project, addressed environmental requirements, done necessary public outreach, design work is completed and it’s on an approved state list.
An example of this failure is that in Michigan +/-90% of the homes in line for weatherization work needed a historic preservation review. But the office responsible had only two employees.
Shovel ready never happened and those jobs that were promised, didn’t.
“Shovel-ready was not as shovel-ready as we expected.” – Obama, June 2011
And so on
Chapter 3: Infrastructure and High Speed Rail – Why it failed and always will
“Barack Obama today called on Americans to climb aboard with his ambitious vision of building high speed rail corridors along 10 of the country’s busiest routes.”
After the big pitch of high speed rail and a slow start, Obama doubled down in his 2011 State of the Union address “Within 25 years, our goal is to give 80 percent of Americans access to high-speed rail.… As we speak, routes in California and the Midwest are already underway.”
With the passage of ARRA, a new Federal program was created to build a comprehensive high speed rail system (HSR) system. Congress agreed to dedicate $8 billion of the $787 billion initially slotted in stimulus spending to begin developing it and Congress approved an additional $5 billion over the next five years and it was agreed that the next highway reauthorization bill would include an additional $50 billion for HSR.
But high speed rail and reality are not on the same tracks.
First off, as it was with “shovel ready”, saying “high speed rail” is imprecise at best, perhaps directionally correct, but nothing ‘real real’
High-speed rail has different definitions in different countries. The EU defines high-speed rail as lines specially built for speeds greater than or equal to 155 mph, or lines that are specially upgraded with speeds greater than 124 mph.
The U.S. defines high-speed differently.
- Emerging rail has speeds of 90 to 110 mph
- Regional rail has speeds of 110 to 150 mph
- Express rail has speeds of at least 150 mph
There are four major types of high-speed rail:
- Dedicated: separate highspeed tracks that exclusively serve high-speed trains. The system was developed because the existing rail network is heavily congested with conventional passenger and freight trains and the track gauge does not support the new high-speed trains.
- Mixed high-speed: both dedicated, high-speed tracks that serve only high-speed trains and upgraded, conventional tracks that serve both high-speed and conventional trains.
- Mixed conventional: dedicated, high-speed, standard-gauge tracks that serve both high-speed and conventional trains equipped with a gauge-changing system, and conventional, nonstandard gauge tracks that serve only conventional trains.
- Fully mixed: most of the tracks are compatible with all high-speed, conventional passenger and freight trains
This problem of “what is it” was one reason that the High Speed Rail had to be rethought.
First and foremost, American high speed rail is lousy… but our commercial rail system, that thing that actually moves trade and commerce, is the best in the world.
In January 2010, the Federal Railroad Administration (FRA) announced that it would spend more than half of the $8 billion in the so-called HSR grants on freight railroads track improvements that would benefit them and existing and prospective slow-speed Amtrak service that shares the same tracks under contract with the freight railroads that own the tracks on which Amtrak operates.
States said no ‘I don’t want it’, except for California, cos pay me
The envisioning of High Speed Rail connected cities and into dense urban clusters where they would connect with airports, etc. But that also significantly slowed down their actual speed and the time savings, and the convenience.
Another issue is that the state’s own debt problems would have not been able to handle the additional burden of having to do a new bond offering to cover the billions on costs not covered by ARRA money.
After doing analysis, Ohio and Wisconsin declined Federal funds and returned ARRA grant money. Florida declined anchoring an east coast rail line. It’s a long story and I’ll tell you some other time, you’ll get bored.
Moving on. To California and their high speed rail
The California train, with proposed speeds of “up to” 220 miles per hour, was selected as the test track for the country.
It’s been delayed for 9 years.
California – a high speed rail you can poop on
The estimated price tag is now equivalent to 37 times the annual federal subsidy for Amtrak.
As soon as funds were made available, an initial 119-mile segment through the economically depressed, relatively flat and empty Central Valley was decided as the optimal start because it was the easiest-to-build stretch of a planned $64 billion line, which would one day, maybe, move passengers between San Francisco and Los Angeles in under three hours.
The original rationale for starting in the middle was that all stimulus dollars had to be spent by September 2017, and the Central Valley run seemed relatively “shovel-ready” It didn’t require massive urban redevelopment or daunting tunnels.
Clearly, though, even the out-of-the-way Central Valley section was less shovel-ready than expected. There have been bitter lawsuits over financing and environmental permitting. There have been protracted negotiations over many of the 1400 parcels the state needs to purchase or seize through eminent domain.
So, what went wrong with California.
- Legally defining project parameters in ways that can never be changed. In 2008, California voters approved Proposition 1A, which enacted a new law authorizing construction of the high-speed rail system and authorizing the issuance of $9 billion in bonds to fund planning, design and construction. However, the law enacted by Prop 1A was exceedingly detailed, and prescribed the route, minimum speed between each set of major destinations, number of stations, headway times, and other metrics. And in California, laws enacted by ballot initiative can never be amended by the state legislature without going back to voters
- Appropriating funds with a short deadline for greenfield projects and untried technologies. Out of the blue, the February 2009 ARRA stimulus law appropriated $8 billion for a new high-speed and intercity passenger rail grant program, at the behest of White House chief of staff Rahm Emanuel. Because ARRA’s legislative momentum was all about immediate response to the Great Recession, the high-speed rail money had two deadlines – every dime had to be legally obligated by September 2012, and every dime had to be spent by the Treasury by September 2017. This decision by the White House and Congress in turn led to a lot of bad decision-making down the line by forcing the Department of Transportation to give money to projects that were barely in the design phase and for which the technology did not yet exist in the U.S., lest the money be forfeited.
- Committing federal dollars for construction of a project that is clearly not ready for construction. Because of the deadline pressure from the stimulus law – and because the new Republican governors of Florida, Wisconsin and Ohio turned back their shares of the $8 billion upon taking office in early 2011 – the Department of Transportation wound up giving $2.6 billion of ARRA’s $8 billion to the California project. They then followed that up with another $929 million of fiscal year 2010 appropriations enacted a few months later. A full $3 billion of that $3.5 billion was dedicated to construction, despite the fact that none of the environmental analysis was complete and that the financing plan for the project was still sketchy.
Why do we need high speed rail? Cos we don’t
European and Asian governments have paid staggering sums to subsidize a mode of travel that only a small and shrinking share of their populations uses.
“Between 2000 and 2017, EUR 23.7 billion was spent from European funds. European added value has hardly ever been taken into account as a criterion for that expenditure; nor have the TEN-T objectives. By far the largest part of the European funding has gone to Spain. Yet Spain’s high-speed rail network is the least viable in Europe” – EU questions to ts finance
In what alternate dimension does it make sense to send tens of billions of dollars on a rail few people will use and will require subsidies just to continue to operate?
The American mode of travel is by air and that trend has taken over the world, as a real time and leading indicator note all the new passenger planes bought from Boeing and Airbus.
Why would anybody not getting paid advocate for High Speed Rail? Lets look at the arguments they present vs the arguments they fail to present:
- Environment: HSR creates more pollution than it prevents because building a HSR line is very energy-intensive. The California Air Resources board estimated there are many more cost-effective ways to improve the environment than building HSR between Los Angeles and San Francisco.
- Economic Development: HSR does not create much new development; it merely redirects development from one area to another.
- Safety: While HSR is relatively safe, most potential rail passengers travel by an even safer mode, aviation.
- Choice: Customers can already choose between a low-cost bus, a fast plane or a personalized car trip. Is another choice necessary? Spending an equivalent amount of funds on aviation or highways could do much more to solve America’s transportation problems.
“Stop talking about Europe and China please, thank you” – Management
High-speed rail’s limited success in other countries doesn’t transfer to the United States.
- Our rail network is mostly owned and used by freight companies. Competition, labor laws and a lack of innovation pushed most railroads towards bankruptcy and Congress had created Amtrak in 1970 to operate passenger service and allowed them to shed passenger service. Freight rail companies are now profitable. However, this meant the United States has little passenger rail service.
- Most countries built high-speed rail to relieve overcrowding on their existing lines. The U.S. lacks this overcrowding; further, freight rail dominates track usage. Increasing passenger operations on these tracks would increase shipping costs and delays.
- It is also important to remember that any U.S. rail operator will have to compete on the same terms that cause Amtrak to lose large amounts of money each year.
- Railways are subject to outdated labor laws such as the Railway Labor Act of 1926, the Federal Employers Liability Act of 1908 and the Railroad Retirement Act of 1934. These outdated laws were enacted when railroads did not face competition from automobiles, buses and planes.
- While private competition might decrease costs, the government would have to pay the private sector to become involved, since operating a passenger railroad in the existing U.S. regulatory environment is not a profitable proposition.
- The U.S. has a different spatial structure than most countries. U.S. core cities, where people are most likely to board HSR trains, are substantially less dense than European or Asian cities. In markets like Shanghai because of their large population density they can run an HSR on that line profitably, all we have is NYC
- America has far higher rates of car ownership than most other countries, because the cost of using a personal vehicle is cheaper here.
- Most other countries also toll their highway network: China, France and Spain have tolled highway networks; Germany charges tolls for trucks on its autobahn. The U.S. Interstate system is the only 6,000 mile plus highway network free to both cars and trucks. The result is that many American cities, especially southern and western cities such as Atlanta, Houston, Los Angeles and Phoenix, have built up around the car.
And so on
Chapter 4: Infrastructure and Cash for Clunkers. Clunked
The idea behind “fiscal stimulus” is to boost consumption when demand is low. The never ending debate in policy is whether governments can spur economic activity through fiscal interventions.
There are essentially two policy combatants:
- ‘Keynesians‘ economics calls for large, shock and law fiscal interventions in the economy. They argue that fiscal stimulus can bring forward aggregate demand from the “far off future” – when the economy will be operating at close to capacity – to today – when there is substantial slack and higher marginal benefit of production
- The opposition to Keynesians’ theory argues that fiscal stimulus is at best irrelevant and can actually be harmful for many reasons including the speed with which private sector adjustment nullifies fiscal interventions.
Some cars did some things
The Consumer Assistance to Recycle and Save (CARS) Act, was a nationwide vehicle scrappage program affectionately called “Cash for Clunkers” that was signed as law on June 24, 2009 that offered consumers a rebate of $3,500 or $4,500 toward the purchase of a new fuel efficient car provided they scrapped a used vehicle.
It was not included within American Recovery and Reinvestment Act (ARRA) but is is helpful to have this reverse engineering of government spending policy. It will come in useful thruout these chapters and specifically on the next chapter about “electric cars”, which was a part of ARRA
The eight week program made transactions eligible for rebates on July 1, 2009 and ended on August 24, 2009. Congress allocated a total of $3 billion toward subsidies.
The program was different from other stimulus programs in that it aimed to increase consumer spending on a particular durable good, new cars.
There was a rational reason for designing the program to target durable goods.
- The manufacturing sector lost a greater share of jobs than any other sector, and on average was responsible for 46% of total job losses despite currently making up less than 10% of overall employment.
- To improve the fuel efficiency of the US vehicle fleet “Ending our dependence on oil, indeed, ending our dependence on fossil fuels, represents perhaps the most difficult challenge we have ever faced …” Obama
Chasing those two policy outcomes clashed:
- Lowering the relative price of fuel efficient vehicles might induce buyers to increase spending by selecting vehicles with more expensive fuel-saving technologies, such as hybrids.
- Restrictions could induce households to purchase smaller, less expensive vehicles in order to meet the fuel efficiency criteria, which would decrease overall new vehicle spending.
The difficulty in doing a post mortem on any stimulus spending policy is finding a valid ‘what if’ counterfactual: what would have occurred in the absence of the policy.
Analysis American Economic Journal: Applied Economics 2017, Hoekstra, Puller, West found that CfC reduced overall spending on new vehicles during the period beginning with the first month of the program and ending eight months after the program.
“The barely eligible households tended to purchase less expensive and smaller vehicles such as the Toyota Corolla, which was the most popular new vehicle purchased under the program. Estimates indicate that each household purchasing under the program spent an average of around $8,000 less on a new vehicle than they otherwise would have. Thus, while the program increased short term spending over the period of a few months, that increase came at the cost of reducing cumulative longer term spending. We calculate that justifying this tradeoff would require an annualized discount rate of 213 percent.
Moreover, we find that the program performed poorly in achieving its secondary objective of improving the fuel economy of the US fleet. We estimate that the program induced households to purchase vehicles that were only three MPG more fuel efficient than the vehicles they otherwise would have purchased. This increase in fuel economy, while still notable, does not lead to reductions in environmental damages that justify the program costs. Specifically, we estimate that each subsidy generated only $253 in environmental benefits, compared to an average taxpayer cost of $4,210 per subsidy. These findings have significant implications for the national auto industry. We estimate that CfC—which dispensed $3 billion in subsidies toward the purchase of 677,000 new vehicles nationally—actually reduced revenues to the auto industry by more than $5 billion over the course of less than one year.”
And so on.
Chapter 5: Infrastructure and 90 billion dollars of green loans
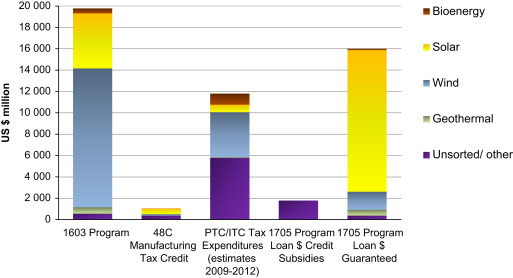
In 2009, the American Recovery and Reinvestment Act allocated and disbursed about $92 billion of the overall budget on ‘clean energy’.
The spend was enacted thru several programs, we’ll spend time on the two largest programs, its where most of the money went.
1603 program
Offered cash payments (30% of the cost) for Renewable Energy properties in lieu of tax credits. This incentivized small-scale and distributed generation, particularly in solar energy, projects had until 2017 to become operational
- Awarded $26 billion to 109,766 projects
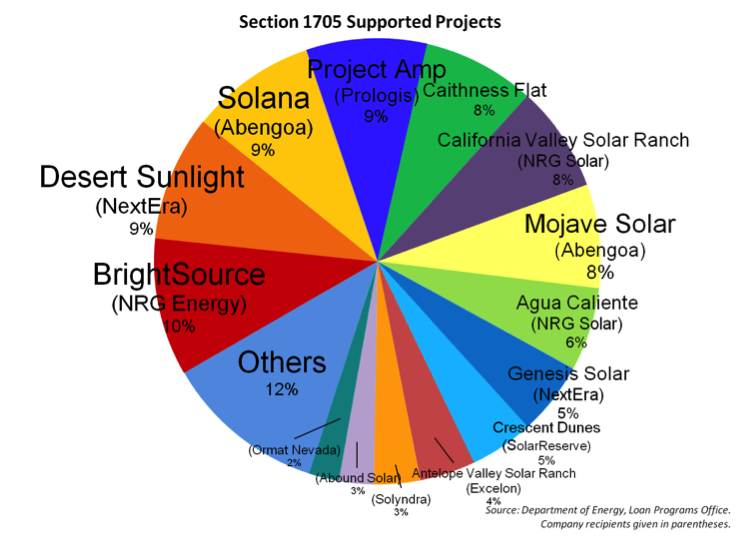
1705 program
A temporary loan program in which the government-guarantees 80% of the loan. with the following project types being potentially eligible:
- Renewable energy systems that generate electricity or thermal energy, and facilities that manufacture related components.
- Electric power transmission systems, including upgrading and replacing existing conductors or wires.
- Leading-edge biofuel projects that will use technologies that are likely to become commercial.
The Department of Energy did not provide loans directly. Instead, borrowers had to apply to qualified finance organizations. These lenders did an analysis of the application. Then DOE reviewed the lender’s credit analysis rather than conducting a second analysis. Finally the DOE made the final credit and eligibility decision.
- If a recipient defaults on its loan, the federal government pays the remainder of the debt to the lenders and repossesses all of the assets from the unfinished projects
- If the loan isn’t repaid, then the cost of the investment is to taxpayers
- If the loan is repaid it’s the lender who benefits from all the interest payments it collected thanks to a fairly risk-free loan, and the borrower will collect the fruit of its successful business venture.
The Obama administration had initially pushed the projects as job generators, claiming that it could create 5 million jobs.
“…can create millions of additional jobs and entire new industries if we act right now. The need for this action has never been more urgent…“think of what’s happening in countries like Spain, Germany and Japan, where they’re making real investments in renewable energy. They’re surging ahead of us, poised to take the lead in these new industries”” President Elect Obama January 16, 2009
Why was Obama recommending that America should copy Spain’s model for creating “green jobs” in “alternative energy”?
Obama was shovel ready type of wrong.
Spain’s unemployment rate in 2009, at the time of Obama’s speech, was at 18% – more than double the European Union’s average. A part of the reason for that failure was Spain’s spending money on green jobs.
Academics in Spain rebutted Obama’s claim and gave a prescient warning…
“for every renewable energy job that the State manages to finance, Spain’s experience cited by President Obama as a model reveals with high confidence, by two different methods, that the US should expect a loss of at least 2.2 jobs on average, or about 9 jobs lost for every 4 created, to which we have to add those jobs that non-subsidized investments with the same resources would have created” – (Alvarez at el, King Juan Carlos University, Spain, 2009).
Once government subsidies dried up, Spain’s solar power industry collapsed and “each ‘green’ megawatt installed destroyed 5.28 jobs on average elsewhere in the economy”
The following are points from that report, the “Study of the Effects on Employment of Public Aid to Renewable Energy Sources“:
- Since 2000 Spain spent $800,000 to create each “green job”, including subsidies of more than $1.4 million per wind industry job
- Programs creating those jobs also resulted in the destruction of nearly 110,500 jobs elsewhere in the economy, or 2.2 jobs destroyed for every “green job” created and, only one of ten jobs created was permanent.
Now it’s 2022 and we are looking at a new Biden Infrastructure bill with massive spend on “green”.
But what can we learn from what came before?
To get the deal passed the ‘clean energy’ stimulus was the subject of much attention, enthusiasm, and promise but after implementation there have been no true holistic evaluations of the performance.
There is no consensus on an analytical framework and indicators, how do you measure a concept, and what do you measure?
Is it the total of…
- Installed capacity (GW or MW) and generation
- Share of renewable energy
- Domestic manufacturing capacity
- Reduction of CO2 emissions
- Job creation
- Energy costs
By all measures to an honest observer it failed, let’s look at who, what, when, how and why:
- 26 projects were funded under the 1705 program
- 2,378 permanent jobs were claimed to be created under the program at its completion. $6,731,034 per job
Distribution projects
Most of the money has gone to large and established companies rather than startups. These include established utility firms, large multinational manufacturers, and a global real estate investment fund.
In addition, the data shows that nearly 90 percent of the loans guaranteed by the federal government since 2009 went to subsidize lower-risk power plants, which in many cases were backed by big companies with vast resources. This includes loans such as the $90 million guarantee granted to Cogentrix, a subsidiary of Goldman Sachs.
By 2012, a year after the U.S. government raced to meet a deadline to finish loan agreements with dozens of clean energy companies, less than half the total money promised had been handed over.
Technical questions and companies’ own failures in hitting contractual milestones are behind some of the holdups. On top of that Renewable Energy projects in general got hurt by low natural gas prices, uncertainty about federal tax credits, and the failure of Congress to legislate a federal mandate for using solar, wind and geothermal power.
A deep dive by Mercatus proved that Department of Energy policies served any of its public policy purposes.
The allocation of loans was miserable and 22 out of the 26 projects were rated as “junk” grade investments or lower, and the other four projects were rated in the “BBB” range, the lowest “investment” grade class.
Lotsa reasons ‘what happened?’ but chef amongst them is perhaps that the program failed to manage its portfolio by diversifying, investing in multiple companies with different risk and return characteristics
Instead there was an excessive concentration of investment in just a few companies. For example, just four firms received 68 percent of all loan guarantees allocated under the Section 1705 program.
Another bigly reason is that loose eligibility criteria, and simultaneously an obligation to distribute the loan guarantees in a narrow timeframe.
And another bigly reason for all the self dealing to the largest corporations and their own pet projects was the allocation and approval of loans was a run as a political office.
For example Steve Spinner, a well known Obama bundler was the Obama campaign “liaison to Silicon Valley.” When Obama became President, Spinner joined the Department of Energy as the “chief strategic operations officer” for the loan programs.
The only post mortem we can do here is a glimpse at jobs.
Department of Energy has claimed that the the loans and loan guarantees created over 60,000 jobs and ‘accelerated the United States into a clean energy future’.
Accelerated is a shovel ready type of word play, so we’ll put that ambiguity aside.
Jobs, a few
A promise of retraining for people who lost their jobs due to the Green New Deal, such as coal, pipeline, fossil fuel workers and general training to bring new peopl einto the green workforce?
ARRA allocated $500 million for “green” worker training. This was supposed to train 124,893 people, but by 2012 the Labor Department Inspector General found the program:
- Only trained 52,762, 42 percent of the target
- Only 8,035 actually got jobs, 10 percent of the target
DoE’s estimated job creation of over 60,000 jobs is absurd in that it accounts for temporary construction jobs, projected permanent jobs and estimated ‘saved’ jobs and it should also be noted that jobs may not have been created solely as a result of grant funding.
The projects created far more temporary construction jobs than permanent jobs. For example, First Wind of Hawaii got a loan guarantee of $117 million to construct a wind power plant currently generating 30 megawatts of electricity, created about 200 construction jobs, but only supports 14 permanent jobs.
In terms of job distribution of whatever was out there, the stimulus was poorly targeted to those in economic need.
Research on the geographic distribution of stimulus funding showed it aligned with policy goals of advancing clean energy, medical and scientific research, repairing existing infrastructure, and subsidizing state and local government services – but not targeting areas with the highest unemployment.
What went wrong?
- Guarantees distorted market signals that would otherwise determine where capital should be invested
- Loan programs are Congressional pets because they can approve billions of dollars to benefit special interests with little or no immediate impact to federal appropriations
- Resources that the government offers are like crack and companies become addicted, orienting themselves away from producing what customers want, toward pleasing what the government is paying for. We; talk about the electric car ‘Volt’, next
Most importantly is the failure to measure success, or failure, in real time and…
Loan guarantee programs are unable to save failing industries or to create millions of jobs, because the original lack of access to credit markets is caused by serious industrial issues and market/consumer appetite, not any lack of available capital.
And so on
Chapter 6: Infrastructure and cars, batteries and the Volt
ARRA invested heavily in the development of technology for electric cars, appropriating $2.4 billion for domestic production of batteries and components for electric cars.
- $1.5 billion in grants were directed toward manufacturing the batteries
- $900 million went to building new facilities or improving existing facilities to produce electric drive components
additional money thru 705 programs and misc
- $151 million to Michigan-based Compact Power, Inc., for production of lithium-ion polymer battery cells for the GM Volt
- $105 million directly to GM for production of high-volume battery packs for the Volt
- $105 million to GM to construct facilities for electric drive systems
- $89 million to Delphi Automotive Systems, a former division of GM, to expand manufacturing facilities for electric drive power components
“The announcement marks the single largest investment in advanced battery technology for hybrid and electric-drive vehicles ever made. Industry officials expect that this $2.4 billion investment, coupled with another $2.4 billion in cost sharing from the award winners, will result directly in the creation of tens of thousands of manufacturing jobs in the U.S. battery and auto industries.” – White House statement
ARRA modified existed tax credits for vehicles purchased after 2009 to $2,500–$7,500, depending on the battery capacity.
The federal government has also announced tighter rules on fuel efficiency, increased the average fleet-wide fuel economy requirements to 34.1 miles per gallon by 2016.
The nucleus of electric cars is the creation of the next generation lithium-ion batteries.
The product of the loans and grants is incalculable.
A breakthrough in batteries would not only allow cars to go farther, but smartphones to last longer, solar and wind generators to better store the power they produce, etc.,
Batteries did improve somewhat, they are lighter and have greater storage capacity. But still they only have a life expectancy of 120,000 miles and a replacement cost as high as $15,000.
Innovating is not just the battery, so many catches
- Not only must battery manufacturers innovate the technology, but also new business models as they find the right combination of capacity, performance, durability, size, weight, and cost.
- Not only must they do all this, they have to battle against bureaucracy and regulations and inconsistency in State and Federal regulations
- Not only must they do all this, they also have to rely on sustained consumer demand thru Federal mpg and emissions standards
- Not only must they do all this, but they have to battle with the economics of competing with gas at $2 a gallon
Case study: Chevy Volt. When it rains it pours.
The Volt debuted in 2010. It innovated a ‘serial hybrid electric‘ that uses only electric energy until the battery is depleted, then goes gas.
Chevy, how far can it go and what’s it gonna cost me (approximate)
- 93 miles-per-gallon equivalent (MPGe) in electric-only mode
- 37 MPG in gasoline-only mode
- “combined composite” rating of 60 MPG
- 25–50 on battery along
2013
Majority of purchased cars were sold to households whose annual income is greater than $100,000 and to corporate owned fleets, and to the government. Less than 10% of Volts were bought by households with income below $50,000
Consumer resistance
(All prices as of 2012)
Even if electric cars save fuel, they still cost more to own than similar gasoline-only vehicles.
- Market price for a Chevy Volt is $41,000
- Comparable gasoline-only vehicle is the Chevy Cruze, which has a market price of $17,000–$22,000
Going electric costs an additional $20,000; however, the government narrows this differential through a taxpayer-funded financial credit of $7,500.
Volt
- EPA projects monthly fuel costs to vary between $50 (2012 pricing, approximately $2 a gallon) per month with all electric driving and $112 when using gasoline only
- Edmunds.com estimates monthly fuel cost for the Volt to be $54 per month based on likely usage patterns.
Cruze
- EPA projects that the Cruze will use $142 of gasoline per month.
- $88-a-month savings on fuel might looks bigly bu the savings is not worth the higher sticker price, even with a $7,500 subsidy
One way of doing the comparison is to calculate how much more a car buyer could afford with the $88 per month in fuel savings.
- Using a 5% interest rate, $88 per month for 120 months would finance an additional $8,297 at the time of purchase
- This is nowhere near enough to pay the $20,000 premium ($12,500 with tax credit) necessary to upgrade to a Volt
The Volt. All bad things come to an end
In 2017, Chevy, owned by General Motors, introduced the Bolt EV, a fully electric vehicle that ran 238 miles on pure electric power.
GM announced in early 2019 that they will discontinue the Volt, as well as shut down several of their factories. The Volt sold fewer than 20,000 units a year.
It’s total sales, spanning 9 years was 148,000 cars
2021:
China
- Largest single market, electric and hybrid-powered vehicles is 3,521,000 units in 2021
- Batteries: Chinese manufacturers Contemporary Amperex Technology Company Limited (CATL) and BYD Auto are trying to box out battery competition and have mostly taken market share from South Korean companies.
United States
- Total sales of all electric variations and hybrid sales, 800,000 in 2021 (rounded as it gets tricky)
- Batteries: forgetaboutit
And so on
Chapter 7: Infrastructure, Is Government still the right way to do it?
We’ll discuss highways, bridges and roads soon. Before then is two chapters, start here:
Is Government Investment the Best Means of Delivering Infrastructure?
The justifications for government’s allocation of taxpayer money, provisioning, allocation and disbursement and oversight of infrastructure projects can be broken into three buckets:
Markets fail and require correction
- Transport and water infrastructure may be “public goods” meaning they might be unprovided or underprovided in a ‘free market’.
- The potential lack of private sector investment in such projects may prove that private investors consider the project too risky or uneconomic.
Cost of government borrowing is cheap, and it is economical for governments to invest
- Taxpayer endless spend’ers argue that the government should do large-scale investment because government borrowing is cheap. Any kid on an allowance, CEO or retail store owner, says that a less costly time to invest is not the same as a good time to invest.
- The fact that private-sector companies are not investing massively at low rates in infrastructure projects suggests that it may simply be that expected returns are bad and uncertainty is high
Governments can put social ambitions above commercial interests
Public capital can play an important role in increasing long-run output and standards of living, indeed there is a role for a properly functioning government to raise social welfare by providing it public capital.
And here is a key question…
Does Government Infrastructure Spending Boost Growth?
To say that public capital investment has historically increased growth tells us nothing of the desirability or growth effects of new projects.
The fact that some bridges in the past have enhanced growth tells us nothing of the desirability of a new bridge today. Will a new Hoover Dam bring the same return as the existing one? Is there any place in the country that public dollars in would return that staggering multi generational yield? Would the cost of union labor and commodities wildly inflate costs and distort the market?
Does a Need for Significant Government Infrastructure Investment Exist Now?
The true state of American infrastructure is better than Obama’ians and Biden’istas suggest.
But even if the claims of widespread disrepair were true, would full repair and upgrades of existing infrastructure be a good proxy for how much government infrastructure investment is needed?
Absent a real market, how much infrastructure is wanted or needed is difficult to quantify. What level of congestion would drivers on a particular road be able to tolerate before they were willing to finance road expansion
- “This road is so bad I will pay more not to travel it”
- “If I got to work 10 minutes earlier it will increase my wages?”
Markets are good at finding the optimal mix of infrastructure spending over time and rewarding those that are better at satisfying demand.
And so on
Chapter 8: Infrastructure and Crowding out. The Federal government vs everything else
Crowding out. This is an effect that occurs when increased government spending reduces spending from other sources.
- Federal funds replace or ‘crowd out’ state funds allocated to their own projects.
- The deep pocket Federal checkbook bids up the cost of commodities like woods and metals needed for projects. This ‘crowds out’ by pricing States, cities and municipalities from completing their own projects and for private investment projects it significantly changes the anticipated returns of private investments
Let’s look at how its results on Government vs Private Investment:
Crowding Out Effect Example
Suppose a firm has been planning a capital project
- It’s calculations assume the interest rate on its loans is the current market of 3%
- Estimated cost of $5 million and a return of $6 million,
- The firm anticipates earning $1 million in net income.
But then, due to the shaky state of the economy, the government announces a stimulus package that will help businesses in need but will also raise the interest rate on the firm’s new loans to 4%.
- The interest rate the firm had factored into its accounting has increased by 33.3%
- Its profit model shifts and the firm estimates that it will now need to spend $5.75 million on the project in order to make the same $6 million in returns.
- Its projected earnings have now dropped by 75% to $250,000…
So… the company decides that it would be better off pursuing other options.
The Government vs the States
That same Federal spending program can “crowd out” state spending activity and thus have no net effect on government spending overall.
In a post-mortem of ARRA a big problem was that as states spent Recovery Act highway grants, states simultaneously slashed their own contributions to highway infrastructure, freeing up state dollars for other uses, and that receiving grants appeared to have no causal relationship on total state spending.
In this example States used the increased federal spending as an opportunity to accumulate financial assets during the earliest phases of the Recovery Act.
Federal dollars used to pay for essentially local infrastructure projects has created a dynamic in which State and local governments delay projects in the hope of receiving Federal funds.
In shorthand – the economic effects of federal expansions are undermined by the contractive effects of state and local governments.
As we dig into the corpse of ARRA we can see the compound of the comorbidities…
Infrastructure projects have long lead times.
Infrastructure investments require coordination among federal, state, and local governments and have to go through a long process of planning, bidding, contracting, construction, evaluation and additional government-imposed constraints, such as land-use planning laws and environmental audits, these can delay projects for years and drive up the cost and imperil the project, all of this while the effect of crowding out ravages the market as if in economic war.
And, as the time to deploy is close to forever, it is important to remember that Federal money is allocated during harsh economic times, but not fully deployed until after the economy has already improved on its own, thereby crowding out interfering with the correct actions of the market and causing disruption years out.
And so on