Table of Contents
- 2023: YEAR IN REVIEW
- 1. 2024: BALANCE OF PAYMENTS IN Q1 2024
- 2. EXECUTION OF THE FEDERAL BUDGET IN Q1 2024:
- 3. REGIONAL BUDGETS IN 2023: MAIN TRENDS AND PROSPECTS
- 4. RUSSIA’S FOREIGN TRADE IN Q1 2024:
- IMPORTS DECLINE ON THE BACK OF THE RISKS OF SECONDARY SANCTIONS
- The dynamics of Russian trade turnover
- Russia’s Foreign Trade in Q1 2024
- The share of Russia and China in mutual trade turnover
- The share of Russian metals on the Chinese market has grown.
- Discounts on Russian oil and LNG
- Import price for Russian oil (US dollars per barrel)
- Supplies from China and secondary sanctions
- 5. INDUSTRIAL PRODUCTION: IN JANUARY-APRIL 2024
- 6. S&P report on Russian Manufacturing
- 7. BRICS
- 8. World Bank report on Russian household wealth
2023: YEAR IN REVIEW
The main economic result of Russia in 2023 evidenced resumption of economic growth, which reached 3.6% after a drop of 1.2% in 2022. The cumulative GDP growth since 2019 accounted for 5.4%.
The manufacturing industry (mainly machinery and instrumentation),
construction, trade and catering, information and communication services became the main drivers of economic growth.
However, a certain stagnation was observed in a number of sectors of the
economy: extractive industry and transportation. The main reason for this slowdown was the change in terms of foreign trade: the trade surplus declined by 2.6 times compared to 2022, from $303 bn to $120 bn. This was mainly due to a reduction in exports, as well as a result of some growth in imports.
External sanctions and related transportation, logistics and payment/ settlement problems became the main factors behind the decline in exports.
Russian exports in 2023 amounted to just over 70% of the 2022, while the main reduction accounted for mining products, but significant decline took place also in chemicals and wood processing. Imports into Russia increased by almost 10% mainly due to growth in imports of machinery and equipment, vehicles, as well as textiles and footwear.
Radical changes in the structure of trade balance became the main factor of pressure on the ruble exchange rate, which at the end of Q3 2023 came close to the Rb100 /$1, which became one of the main drivers of inflation in mid-2023.
The Bank of Russia raised the key rate several times in Q2 2023, more than doubling it from 7.5% to 16%.
Along with other regulatory measures of the Central Bank, this allowed
stabilizing the ruble exchange rate and inflation at below 8% per year with good prospects for its reduction in 2024.
Despite a significant decline in exports and, consequently, a reduction in
export revenues, the tax and fiscal situation in 2023 proved to be quite good.
Fiscal revenues of the enlarged government grew by Rb6 trillion and amounted to Rb59 trillion. In real terms, fiscal revenues of the enlarged government grew by 3.6% (in 2022 they fell by 1.5%). Fiscal spending of the enlarged government reached Rb63 trillion and increased in real terms by 6.3% (by 2% in 2022).
The enlarged government budget deficit amounted to 2.3% of GDP.
A rather radical restructuring of the fiscal revenue base is behind these very favorable figures. Oil and gas revenues of the federal budget declined in 2023 by Rb2.7 trillion relative to 2022 (by 24%). However, at the same time, non-oil revenues of the federal budget increased by more than Rb4.0 trillion (by 25%) and significantly exceeded the fall in oil and gas revenues.
Thus, in 2023 Russia embarked on a path of deep structural reorganization of economy with a focus on development of domestic market and reduced dependence on fluctuations in the external economic environment. The policy of the monetary authorities made it possible to keep inflation under control and stabilize the exchange rate. The outstripping growth of non-oil and gas revenues reflects the growing role of the domestic market and makes it possible to compensate for the negative impact of the external environment on the revenue
fiscal base.
The medium-term sustainability of these positive trends will largely depend on the degree to which the infrastructural constraints to the development of domestic market will be overcome and the extent to which the potential decline in commodity exports will be replaced by exports of highly processed products.
1. 2024: BALANCE OF PAYMENTS IN Q1 2024
Note: Unless indicated, all currency and valuations are in US dollars
According to a preliminary estimate on the balance of payments released by the Bank of Russia, the current account balance in Q1 2024 was $22 billion:
- 43% higher than in Q1 2023 ($15.4 bn)
- 91% higher than in the previous Q4 2023 ($10.5 bn)
BALANCE OF TRADE IN GOODS
Is $31 bn:
- 2.3% higher than Q1 2023 ($30.4 bn)
A decisive role in its growth was a reduction in the value of exports of goods from $105 bn in Q1 2023 to $97.9 bn in Q1 2024 and a comparable reduction in the supply of imported goods.
Dynamics of exports:
There was a decrease in prices for the basic goods of Russian exports (oil, petroleum products, grain, coal, ferrous and non-ferrous metals) and the preservation of the physical volumes of supplies of Russian products in January-March 2024 vs the same quarter in 2023.
Dynamics of imports:
According to the Bank of Russia, the depreciation of the real ruble-dollar exchange rate in Q1 2024 vs. Q1 2023 amounted to 16.5% – which means a relative rise in the cost of import supplies.
At the same time, difficulties with cross-border payments, which have worsened since the beginning of 2024, could have contributed to a decline in imports.
BALANCE OF TRADE IN SERVICES
- Q1 of 2024 amounted to -$4.7 bn, which in absolute value was 38% less than the negative balance of trade in services in Q1 of 2023.
- Growth in exports of services (by 12% – from $9.8 bn in the first quarter of 2023 to $11 bn in Q1 2024) was accompanied by a fall in imports (by 10% – from $17.5 bn in Q1 2023 to $15.7 bn in Q1 2024) due to the weakening of the national currency.
As a result, both these changes contributed to the reduction of the negative balance of trade in services.
BALANCE OF PRIMARY AND SECONDARY INCOME
- Q1 2024 is -$4.4 bn, 40% less in absolute value than the same indicator in Q1 2023 (-$7.4 bn).
- Income receivable and income payable decreased in Q1 2024. Income receivable decreased by $1.7 bn (from $11.4 bn to $9.7 bn) and income payable decreased by $4.7 bn (from $18.7 bn to $14 bn) in Q1 2024 compared to Q1 2023.
In general, the decrease in the aggregate deficit of primary and secondary incomes was due to the decrease in dividends accrued in favor of non-residents, as well as outgoing personal transfers.
In the coming quarters, due to continued capital controls and difficulties with repatriation of profits from Russia by foreign investors, primary and secondary income payable will likely not grow and their balance will remain low, with income payable likely to continue to decline faster than income receivable due to capital withdrawal restrictions.
- Imports in value terms are likely to remain stable, but the weakening ruble and tight monetary policy will put downward pressure on them.
- Exports in value terms will likely stagnate because physical volumes of supplies may not grow and prices for the basic goods of Russian exports (oil, oil products, metals, grains) will be at a level roughly corresponding to the 2023 level.
In Q1 2024, the balance of the financial account of the balance of payments excluding reserve assets amounted to $26.2 bn, increasing 1.5-fold compared with Q1 2023 ($18.0 bn).
In Q1 2024, the balance of the financial account excluding reserve assets was formed under the impact of growth in foreign assets and decrease in the volume of foreign liabilities.
The increase in foreign assets (excluding reserve assets) in Q1 2024 was $22.6 bn: 3.6 times higher than in Q1 2023 ($6.3 bn). The increase in foreign assets can be explained by delays in receipt of payments for increased exports.
The liabilities of all sectors of the Russian economy to non-residents in Q1 2024 decreased by $3.7 bn, which is 3.2 times lower than in Q1 2023 (-$11.7 bn). This is due to the lower intensity of non-residents’ withdrawal from the equity of Russian companies.
Russia’s external debt in Q1 2024 decreased by 4.1% to $304.0 bn.
External debt of other sectors decreased by 4.2% to $181.4 bn in Q1 2024 on attracted credits, including those under direct investment relations, of banks and the Central Bank of the Russian Federation (by 4.2% to $90.8 bn in Q1 2024).
In Q1 2024, external liabilities of public administration bodies decreased by 2.8% to $31.8 bn.
The share of non-residents in the OFZ market (these are ‘Federal Loan Obligations’, coupon-bearing federal loan bonds issued by the Russian government. The Ministry of Finance auctions off OFZs to finance the federal budget, or less commonly, to bail out troubled banks) continued to decline from 7.4% as of January 1, 2024 to 7.2% as of March 1, 2024.
Russia’s reserve assets decreased by $6.9bn in Q1 2024 (-$5.1 bn in 1Q 2023). This was mainly due to the sales of foreign currency within the framework of operations with the National Welfare Fund, as well as a temporary increase in the limit on swap transactions for the sale of yuan for rubles in March in order to smooth the volatility of money market rates.
International reserves decreased by $8.2 bn to $590.4 bn, with foreign exchange reserves falling by $18.4 bn to $424.3 bn, while the value of monetary gold increased (Monetary gold is gold that is owned by monetary authorities or others under their control and held as a reserve asset. It is considered a financial asset and is part of a country’s official reserves or international financial institutions’ portfolios, such as the IMF and BIS) by $10.2 bn to $166 bn as a result of positive revaluation.
Starting from 2024, the Bank of Russia resumed operations in the foreign exchange market using its Russian National Wealth Fund: during the first six months of 2024, the regulator plans to buy or sell foreign currency, adjusting the volume of operations announced by the Russian Ministry of Finance within the framework of the budget rule by the amount of currency sales in the amount of Rb2.1 trillion (Rb1.4 trillion – the difference between the volume of currency purchases deferred from August 10 to December 31, 2023 within the framework of the budget rule and the volume of expenditures of the National Wealth Fund to finance the budget deficit in 2023 outside the budget rule, Rb0.7 trillion – sale of foreign currency in the volume of net investment of the National Wealth Fund’s funds).
- The planned currency sales in the first half of 2024 were intended to support the ruble.
- In Q1 2024 the volume of operations of the Russian Ministry of Finance on net sale of foreign currency on the domestic foreign exchange market amounted to Rb552.4 bn.
- The volume of net purchase of foreign currency within the framework of regular operations under the budget rule in Q1 2024 amounted to approximately Rb130 bn
- The volume of operations announced by the Russian Ministry of Finance within the framework of the budget rule in the form of sales of foreign currency from the National Wealth Fund reached about Rb684 bn.
In 1Q 2024, the ruble depreciated by 3% to 92.3 Rb/dollar which was mainly due to:
- a decrease in net foreign currency sales by major exporters in Q1 2024 ($35.4 bn vs. $41.2 bn in Q4 2023)
- lags in export payments
- expectations of additional sanctions and growth in net foreign currency purchases on the stock exchange by non-residents from friendly countries.
The ruble was supported by the continuation of tight monetary policy, as well as by the sale of foreign currency by the Bank of Russia as part of the operations of the Ministry of Finance of Russia with the funds of the National Wealth Fund.
In Q1 2024 net sales of foreign currency reached Rb552.4 bn against Rb308 bn in Q1 2023 and Rb51 bn in Q4 2023.
According to estimates, if oil prices remain at around USD 80/bbl, as well as taking into account the monetary policy pursued by the Bank of Russia and the preservation of measures on the mandatory sale of foreign currency earnings by the largest exporters, the ruble exchange rate will average Rb90–100/USD in 2024.
2. EXECUTION OF THE FEDERAL BUDGET IN Q1 2024:
NON-OIL AND GAS REVENUES MAKE UP FOR GROWTH IN EXPENDITURES
In January-March 2024, federal budget revenues were Rb8.7 trillion, that is, the local maximum of 22.3% of GDP as compared to recent years’ relevant periods.
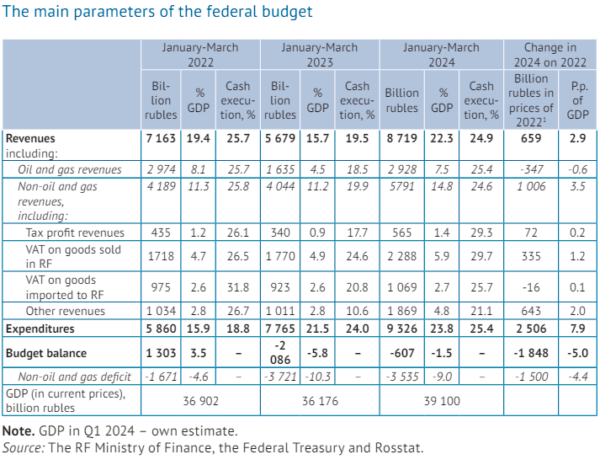
In January-March 2024, the volume of oil and gas revenues increased to 7.5% of GDP, this is growth of 3.0 p.p. of GDP on Q1 2023, while relative to the same period of 2022, a decrease of 0.6 p.p. of GDP or Rb .3 trillion in prices of 2022.
(GDP per capita based on purchasing power parity (PPP). PPP GDP is gross domestic product converted to international dollars using purchasing power parity rates. An international dollar has the same purchasing power over GDP as the U.S. dollar has in the United States)
Oil and gas revenues account for a third of all federal budget revenues
Apart from the ruble exchange rate and quite high oil prices, the dynamics of oil and gas revenues were influenced to a certain extent by the completion of the “tax maneuver,” envisaging the abandonment of export duties on hydrocarbons and petrochemicals by 2024.
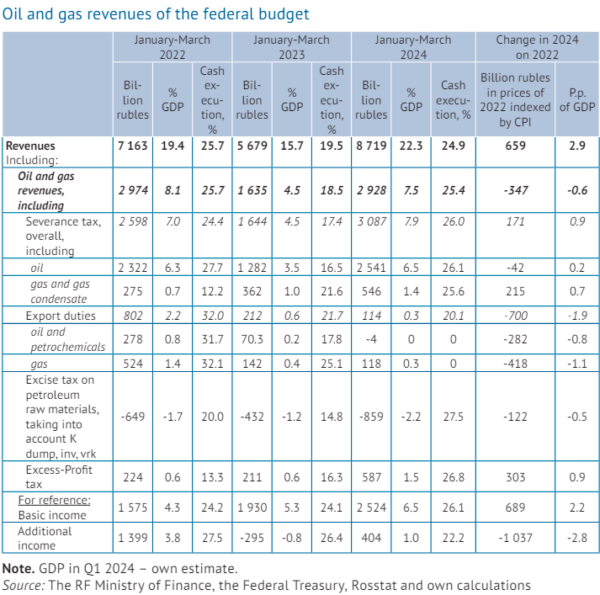
In January-March 2024 the dynamics of the main components of oil and gas revenues demonstrated:
- an increase in revenues from the severance tax both in the oil component (0.2 p.p. of GDP) and the gas component (0.7 p.p. of GDP);
- growth of 0.5 p.p. of GDP in the volume of refundable excise taxes compensated by an increase of 0.9 p.p. of GDP in revenues from the excess-profit tax.
- As a result of the change in the fiscal rule, in Q1 2024 basic oil and gas revenues amounted to about 6.5% of GDP, an increase of 2.2 p.p. of GDP on the relevant period of 2022, while excess oil and gas revenues, subsequently subject to payment to the National Welfare Fund, decreased to 1% of GDP against 3.8% a year before.
- In Q1 2024, non-oil and gas revenues of the federal budget grew at higher rates than in previous years, amounting almost to 15% of GDP or Rb5.8 trillion.
- Relative to 2022, the increase in real terms was equal to Rb1.0 trillion or 3.5 p.p. of GDP. The main growth driver across tax revenues was domestic VAT, which volume increased by 1.2 p.p. of GDP and 1.0 p.p. of GDP on the relevant period of 2023 and 2022, respectively.
(VAT rate of 20% applies to most goods and services in Russia. A Reduced VAT Rate of 10% applies to food, children’s clothes, books, medical equipment and some services)
High growth rates are also demonstrated by profit tax revenues: in January-March 2024 they increased by 0.2 p.p. of GDP and 0.5 p.p. of GDP on the relevant period of 2022 and 2023, respectively.
Based on results of Q1 2024, federal budget expenditures were 23.8% of GDP, an increase of 7.9 p.p. of GDP and 2.3 p.p. of GDP on the relevant period of 2023 and 2022, respectively.
In Q1 2024, a little more than a quarter of the annual volume of the planned federal budget expenditures was spent, an increase of 6.6 p.p. of GDP and 1.4 p.p. of GDP relative to the corresponding ratios of 2023 and 2022, respectively, and this can be substantiated primarily by a speed-up in the rate of conclusion of contracts for supply of goods, work, services for government needs and advance payment thereof.
In Q1 2024, program expenditures (open part) of the federal budget was 10.9% of GDP on the relevant period, this vs the numbers from 2022 and 2023 (8.8% of GDP and 9.5% of GDP, respectively) amid the accelerated cash execution thereof (23.7% against 14.3% and 21.7%, respectively). However, the share of the program expenditures in the overall volume of federal budget expenditures in January-March 2024 decreased to 45.8% against 55.2% in January-March 2022.
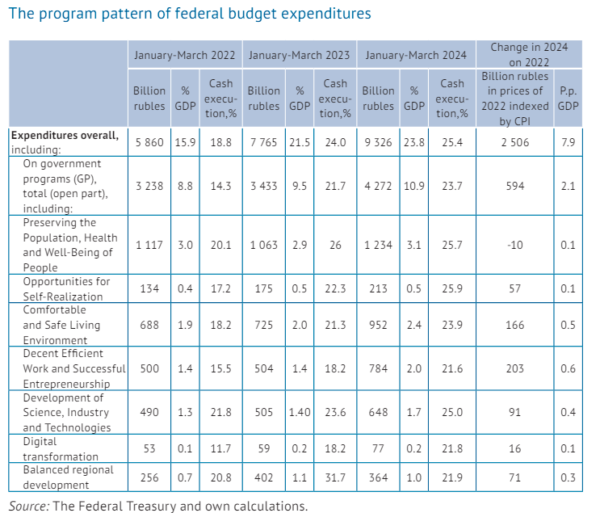
In January-March 2024, an increase in program expenditures as compared to January-March 2022 with the rate of inflation taken into account amounted to about Rb 0.6 trillion or 2.1 p.p. of GDP mainly owing to such lines as “Decent, Efficient Work and Successful Entrepreneurship” and “Comfortable and Safe Living Environment” – growth of Rb203 bn and Rb166 bn or by 0.6 p.p. of GDP and 0.5 p.p. of GDP, respectively.
Based on the results of January-March 2024…
Russia ran a budget deficit of slightly over Rb600 bn, which is equivalent to 1.5% of GDP
OFZs (defined above) remain the main source of budget deficit funding: since the beginning of the year, the RF Ministry of Finance has placed bonds at par value for a total amount of nearly Rb764 bn, thus implementing the quarterly placement plan by more than 95%.
As of April 1, 2024 the government internal debt increased to Rb21.3 trillion, while the external debt, on the contrary, decreased to $52.8 bn.
3. REGIONAL BUDGETS IN 2023: MAIN TRENDS AND PROSPECTS
note:
- Unless otherwise specified, in order to ensure comparability of regional budget statistics, state and municipal debt as well as their growth rates, data are given without data for Donetsk and Lugansk People’s Republics, Zaporizhzhya and Kherson oblasts.
Revenues.
As of year-end 2023, the total revenues of the consolidated budgets of the subjects of the Russian Federation amounted to Rb22.3 trillion (about 260 million in US dollars), up by 13.5% against 2022.
Excluding the data on the new subjects of the Russian Federation, the corresponding volume amounted to Rb21.7 trillion and the growth rate vs. 2022 – 10.1%, which is higher than both the inflation rate (according to Rosstat, in December 2023 against December 2022 the consumer price index constituted 107.42%, and for 2023 vs 2022 – 105.87%) and the growth rate of budget revenues at the end of the fist half of 2023 (+7.3%).
Accordingly, the high growth rates of consolidated budget revenues of the regions based on the results of the whole 2023 are due to the high indicators of the second half of the year, during which the revenues of regional and local budgets increased by 12.7% against the corresponding period of 2022.
In 2023, the highest contribution to the revenues growth of the consolidated budgets of the regions was made by tax and non-tax revenues, whose receipts increased by 15.4% (+24.0% in H2 2023).
The fastest growth rates were the corporate profit tax – +27.8% (+61.7% in H2 2023) and personal income tax – +13.1% (+19.6%).
The growth rates of other major taxes did not exceed the inflation rate:
- excises went up by 6.4% (+7.1%)
- taxes on total income – by 5.1% (+3.6%)
- property taxes – by 3.1% (-5.6%)
- Non-tax revenues rose by 8.0% (+16.9%).
Higher growth rates of tax and non-tax revenues in H2 2023 could be associated not only with higher growth rates of the Russian economy but also with the impact of the transition of taxpayers to payment of taxes through a single tax account, one of the consequences of which was a later transfer of some tax revenues to regional and local budgets.

This had a particularly strong impact on revenues in the first months of 2023.
Uncompensated receipts from other budgets in 2023 as a whole decreased by 11.0% (-26.5% in H2 2023). The negative dynamics was demonstrated by subsidies – -5.8% (-22.8%), subventions – -35.0% (-42.3%) and other intergovernmental fiscal transfers – -28.1% (-43.5%). At the same time, the growth of grants amounted to 4.0% (-8.9% in H2 2023), of which equalization transfers – +8.9% (-0.9%) and equalization of fiscal capacity – +4.0% (-53.4%).
When analyzing the dynamics of intergovernmental fiscal transfers to the regions, it is necessary to pay attention to 2 facts:
- The growth rates of receipts of all types of intergovernmental fiscal transfers in H1 2023 were higher than in the second half of the year. This is explained by more prompt provision of intergovernmental fiscal transfers, which was necessary, among other things, to compensate for delays in the receipt of tax revenues in the first months of 2023.
- Since the new subjects of the Russian Federation are highly subsidized, the inclusion of fiscal transfers to them from the federal budget significantly affects the overall dynamics of transfers. Thus, taking into account the new regions, the total volume of subsidies in 2023 decreased by 5.6%, subventions – by 34.8%, other intergovernmental fiscal transfers – by 22.6%, the volume of grants increased by 52.2%, while the growth rate of the total volume of uncompensated receipts from other budgets was in the positive zone – +2.7%.
As of year-end 2023, positive growth rates of consolidated budget revenues were observed in 69 subjects of the Russian Federation, and the highest – in Khanty-Mansi Autonomous Okrug-Yugra (+37.3%, the main growth was provided by the corporate income tax), Tyumen oblast (+31.9%, corporate income tax), the Leningrad oblast (+27.9%, corporate income tax and uncompensated receipts from state (municipal) organizations), the Republic of Adygea (+24.1%, subsidies) and the Smolensk oblast (+23.8%, corporate income tax, personal income tax and subsidies).
Of the 16 subjects that faced a drop in budget revenues, 6 had a drop of more than 10%:
- Nenets Autonomous Okrug (-18.2%, the main reduction is in corporate income tax, income in the form of the share of profitable products of the state in the implementation of the production sharing agreement for the Kharyaginskoye field project, subsidies and other intergovernmental fiscal transfers)
- Republic of Ingushetia (-17.5%, personal income tax, subsidies)
- Republic of Mordovia (-16.9%, subsidies to support measures to ensure balanced budgets, other intergovernmental transfers)
- Republic of Khakassia (-11.2%, corporate income tax, revenues from placement of budget funds)
- Karachay-Cherkess Republic (-10.9%, subsidies and other intergovernmental fiscal transfers)
- Kemerovo Region-Kuzbass (-10.4%, corporate income tax, subsidies)
Among the regions with a high level of budget revenue decline, there are several with a low level of fiscal capacity, which could raise concerns about their ability to fulfill their expenditure commitments. However, upon closer examination one can see that all such revenue reductions were either a rebound after abnormally high growth rates in 2022 (reduction of personal income tax revenues to the consolidated budget of the Republic of Ingushetia in 2023 by 29.5% is a technical rebound after growth by 80.2% in 2022. In the Republic of Khakassia, corporate income tax in 2023 more than halved (-52.4%) after a 5-fold growth in the previous 2 years) or were related to the completion of co-funding of certain expenditure commitments or were related to the completion of co-funding of certain activities by the Federation and therefore did not affect the current budget execution.
In well-off regions, the fall in corporate income tax receipts after its rapid growth in 2021–2022 was the main reason for the decline in revenues.
The main source of revenues of the new RF subjects in 2023 were subsidies to support measures to ensure fiscal balance (18.1%), other subsidies not related to fiscal capacity equalization and fiscal balance support (57%), personal income tax (10.7%), corporate income tax (2.5%), as well as non-tax revenues (2.1%).
At the same time, the share of tax and non-tax revenues (16.8%) has had a steady upward trend since the beginning of 2023.
High growth rates of the main tax revenues of the regions in H2 2023 reduced the need to provide them with additional financial assistance for the fulfillment of existing obligations and will contribute to the preservation of sustainability of subnational budgets.
Expenditures
As of year-end 2023, the consolidated budget expenditures of the regions (excluding new regions) amounted to Rb21.8 trillion, up by 11.3% against 2022, which is higher than both the inflation rate and the growth rate of budget revenues (+10.1%).
At the same time, the growth rates of expenditures during the year were uneven: after a sharp jump of 20.1% in Q1 2023, expenditures grew much slower in Q2, Q3 and Q4 (+8.4, +9.4 and +10.3%, respectively).
Taking into account the new subjects of the Russian Federation, the total expenditures of the consolidated budgets of the regions amounted to Rb22.4 trillion, up by 14.8% against 2022.
The leaders of growth were:
- expenditures on national defense (+76.3%)
- housing and utilities (+29.8%)
- transportation (+21.1%)
- national security and law enforcement (+20.7%)
- general state issues (+18.1%)
- social security (+15.8%)
- culture and cinematography (+15.8%)
- general education (+12.3%).
Due to the curtailment of many anti-Covid measures, expenditures on health care decreased (-4.1%), while the substitution of regions’ commercial debt with budget loans led to a significant reduction in expenditures on its servicing (-11.8%).
In 2023, the consolidated budget expenditures went up in 75 RF subjects and in 55 of them the growth exceeded inflation for the same period.
The leaders in the growth of budget expenditures were:
- Republic of Adygea (+33.3%, the largest increase in the areas of housing and public utilities, general education and social security)
- Smolensk oblast (+23.9%, housing and public utilities, road maintenance and healthcare)
- Yamal-Nenets Autonomous Okrug (+22.7, housing and public utilities, culture, social security)
- Khanty-Mansi Autonomous Okrug-Yugra (+22.2%, public issues, transportation, road maintenance, housing and public utilities, social security)
- city of Moscow (+22.2%, public issues, housing and public utilities, transport, road maintenance, housing and public utilities, social security).
- Moscow (+22.2%, general state issues, housing and public utilities, social security).
Budget expenditures decreased slightly in the Republic of Ingushetia (-13%), the Republic of Dagestan (-10.5%), the Karachay-Cherkess Republic (-9.4%), the Samara oblast (-9.0%) and the Amur oblast (-2.7%).In 2023, the structure of expenditures of the new subjects of the Federation differed from the corresponding structure of the other regions by a smaller share of expenditures on the national economy (11.6% vs. 23.1%), housing and public utilities (5.9% vs. 12.1%) and education (14.5% vs. 23.2%), but a larger share of expenditures on national security and law enforcement (4.0% vs. 1.4%), pension provision (28.1% vs. 1.1%), and healthcare (13.7% vs. 8.6%).
If we assess the difference in the structure of budget expenditures of the considered groups of RF subjects as the sum of absolute values of deviations in the specific weights of budget expenditures by sections of the functional classification, then throughout 2023 there was a tendency to its reduction.
Regions’ fiscal balance and public debt
The consolidated budget deficit was observed in 52 out of 85 subjects of the Russian Federation, and its total volume amounted to Rb171.7 bn (vs. a surplus of Rb50.6 bn in 2022), or 1.0% of the total revenues of the subjects’ consolidated budgets excluding subventions. Taking into account the new RF subjects, the aggregate deficit amounted to Rb200 bn (1.1% to the total revenues of the consolidated budgets of the subjects excluding subventions).
Among the new regions the consolidated budget of only Zaporizhzhya oblast possessed a surplus.
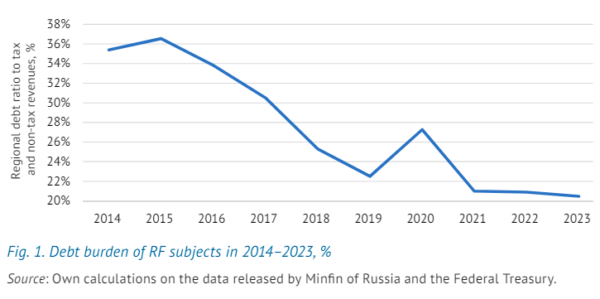
In 2023, intensive provision of infrastructure budget loans from the federal budget pushed up the total volume of the regions’ public debt, which reached Rb3.2 trillion as of January 1, 2024, increasing by 14.5% over the year.
Despite such growth, the level of the regions’ debt burden not only did not increase, but due to higher growth rates of tax and non-tax revenues of the regions even slightly decreased to 20.5% compared to 20.9% as of January 1, 2022, remaining at the minimum level over the last decade.
(The level of debt burden of a subject of the Federation is defined as the ratio of the volume of public debt of the region to the volume of tax and non-tax revenues of the regional budget)
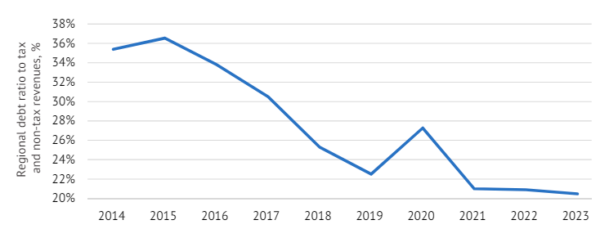
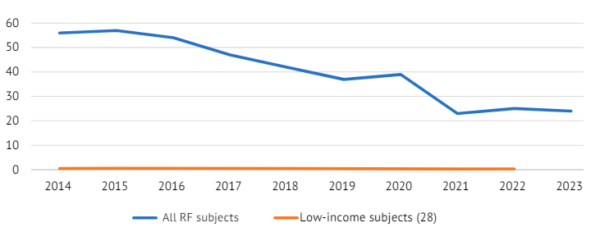
The number of regions with debt burden above 50% in 2023 dropped from 25 to 24 and still does not pose a threat to the stability of regional budgets. For the first time in a long period, as of January 1, there are no constituent entities of the Federation with a debt burden exceeding 100% of the volume of tax and non-tax revenues of the regional budget.
The Republic of Mordovia (the ratio of public debt to tax and non-tax revenues – 93.9%), the Republic of Udmurtia (82.3%), the Republic of Khakassia (79.8%), the Jewish Autonomous Region (77.8%) and the Republic of Kalmykia (77.4%) had the highest debt burden.
In total, in 2023, the public debt of 73 subjects of the Russian Federation increased, while the debt burden increased in 45 subjects.
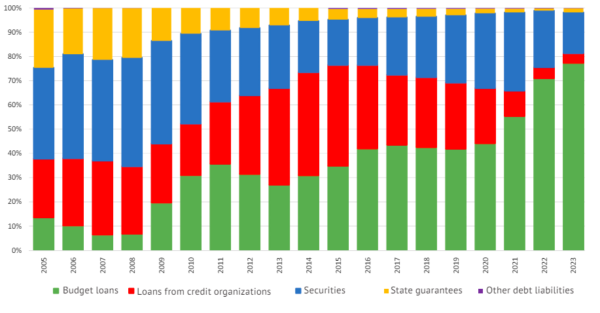
Following the loans of credit organizations, the share of which reached its historical minimum (4.0%) at the beginning of 2024, the share of government securities began to rapidly decline, which also fell to the minimum level (16.8%). In turn, the share of federal budget loans to the regions in 2023 increased from 71.0% to 77.4%.
The shares of state guarantees and other debt obligations continued to balance at around zero – 1.7% and 0.2%, respectively.
Thus, despite a significant increase in the volume of public debt in 2023, the debt sustainability of the regions remains at a high level, which was assisted by high growth rates of tax and non-tax revenues of regional budgets.
The prospects for the dynamics of the regions’ public debt and their debt burden are directly dependent on the specifics of the implementation of the 2024 Presidential Address to the Federal Assembly of the Russian Federation.
On the one hand, many of its provisions provide for a significant increase in the regions’ expenditure obligations in the areas of housing and utilities, social policy and infrastructure development.
On the other hand, a significant part of the new obligations will be co-funded from the federal budget.
In addition, it is planned to gradually write off 2/3 of the accumulated volume of budget loans to the regions (which will amount to about Rb1.2–1.3 trillion).
The balance of regional budgets will also be affected by the announced fine-tuning of the tax system, the results of which can affect the revenues of regional budgets (primarily in terms of corporate income tax). We should also expect a certain redistribution of revenues from more well-off subjects to less well-off ones.
4. RUSSIA’S FOREIGN TRADE IN Q1 2024:
IMPORTS DECLINE ON THE BACK OF THE RISKS OF SECONDARY SANCTIONS
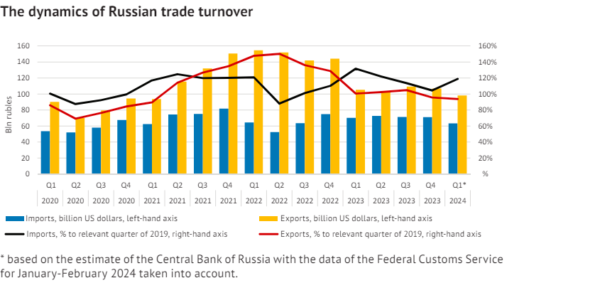
In Q1 2024, Russian exports were equal to $97.9 bn (-6.8% on Q1 2023). In January- February, the share of fuel and energy commodities remained at the level of about 63%. The share of the Chinese market in exports is estimated at 31% (+4.5 p.p. compared to the relevant ratio of the previous year). Supplies of fuel and energy commodities to this market demonstrated multidirectional dynamics. The discount to the price for Russian oil fell to near-zero levels. Supplies of metals to China increased, among other things, owing to restrictions on the markets of unfriendly countries. Russian imports fell to $63.3 bn (-9.8%). The share of Chinese goods in imports is estimated at 43% (+6.4 p.p). After growth in January-February (+12.5%), March saw a considerable decline in supplies from China (-14.2%), probably, due to the risk of secondary sanctions.
The dynamics of Russian trade turnover
In 2023-early 2024, exports in value terms remained at the level of the pre-Covid period.
In 2023, exports amounted to $425.1 bn (101% of the volumes seen in 2019), while in Q1 2024, by estimates of the Central Bank of Russia, to $97.9 bn (94% on Q1 2019).
The short-term dynamics of Russian exports are still determined by the price environment on global energy markets. In January-February, the share of fuel and energy goods in the commodity pattern of Russian exports was equal to about 63% against 61% in 2023.
Russia’s Foreign Trade in Q1 2024
Imports were less stable. After a drop in the volumes of imported goods in H1 2022, a recovery began and it lasted for three quarters. In Q1 2023, imports reached a historic high (132% on Q1 2019) on the back of the effect of pent-up demand and the relatively strong ruble exchange rate.
From Q2 2023, there was a decrease in import volumes relative to the peak values. In 2023, imports amounted to $285.1 bn (117% of the volumes seen in 2019), while in Q1 2024, to $63.3 bn (119% on Q1 2019).
(The Central Bank of Russia’s estimate and the data of the Federal Customs Service for January-February 2024 are used. It is taken into account that the Central Bank of Russia’s estimate for January-February is 5.5% higher than the relevant data of the Federal Customs Service)
It is noteworthy that Q1 saw uneven dynamics: the Central Bank of Russia’s estimate points to a considerable decrease in imports in March (-18% on March 2023) after stable dynamics in February (+0.3%).
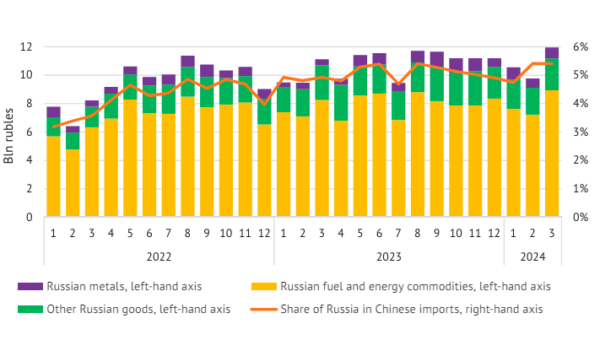
China has been Russia’s main trading partner since 2022. According to the data of the General Administration of Customs (GAC) of China, in Q1 2024 the supplies of Chinese goods to Russia amounted to $24.4 bn (+2.6% on Q1 2023) and those of Russian goods to China, to $32.2 bn (+7.3%).
This led to an increase in China’s share in Russian trade turnover. Based on the results of January-February 2024, Chinese goods account for about 43% of imports2 (+6.4 p.p. as compared to Q1 2023) and 31% of Russian exports (+4.5 p.p).
(Based on the Federal Customs Service’s data on the overall volumes of Russia’s imports and exports in January-February 2024. It is taken into account that the GAC of China’s data on the imports of Russian goods are 14% higher (on average for 2019–2021) than those of the RF Federal Customs Service, while the data on the exports of Chinese goods to Russia are, on the contrary, 8% lower)
For China, the Russian sales market remains secondary, with a share of 3.0% in Q1 2024 (no changes since Q1 2023).
The leading positions in China’s trade turnover are firmly occupied by countries which are unfriendly to Russia and this situation increases the risk of a decrease in supplies owing to a threat of secondary sanctions.
Russia is an important supplier of energy commodities to the Chinese market, while in Q1 2024 Russia’s share in China’s overall imports remained at 5.2% (4.9% a year before).Supplies to China3Fuel keeps prevailing in China’s imports of Russian commodities: at the end of Q1 2024, it accounted for $23.8 bn (+4.7% as compared to Q1 2023), or 74% (-1.8 p.p.)
(Hereinafter, based on the data of the GAC of China without adjustment for the differences in the data of the GAC of China and the RF Federal Customs Service in previous years)
The period of rapid growth in Russian fuel supplies to China on the back of reorientation from the markets of unfriendly countries has ended. The supplies dynamics were multidirectional.
In Q1 2024, China’s imports of Russian oil kept growing, amounting to 28.5 mn tons (+12.9% compared to Q1 2023) or $16.3 bn (+17.9%) in value terms. The share of Russian oil reached 20.8% (+2.2 p.p.). Over the same period, imports of Russian coal decreased to 18.2 mn tons (-22.7%) or to $2.41 bn in value terms (-45.7%). The share of Russian coal decreased considerably to 24.7%, losing 14.6 p.p. over a year. China’s imports of Russian liquefied natural gas (LNG) increased to 1.73 mn tons (+4.7%). However, a more substantial decline in prices led to a reduction in the value of supplies to $1.09 bn (-18.5%).
Russian LNG on the Chinese market fell to 6.2% (-1.1 p.p).
Pipeline gas supplies from Russia continued to grow, amounting to $1.99 bn (+13.1% on Q1 2023).
In Q1 2024, China’s imports of Russian light distillates amounted to $530 mn (+95.9%) or 760,000 tons (+86.4% relative to Q1 2023) and the share in Chinese imports increased to 26.6% (+11.6 p.p.). Over the same period, heavy distillate supplies from Russia amounted to $2.72 bn (+47.9%), or 1.32 mn tons (+44.1%). At the same time, the share of Russian heavy distillates in Chinese imports changed slightly to 29.2% (+1.6 p.p.) owing to overall growth in China’s imports of this type of fuel.
- Supplies of ferrous metals increased to 540,000 tons (+69.6%) or up to $340 mn (+67.8%).
- The share of Russian ferrous metals on the Chinese market amounted to 8.4% (+2.9 p.p.).
Owing to the actual ban on exports of Russian aluminum to the markets of unfriendly countries, its supplies to the Chinese market increased considerably to 400,000 tons (a 2.2-fold increase) or $1.0 bn (a 2.3-fold increase) and the share in imports rose to 25.4% (+6.4 p.p.).
- Copper imports also grew to 93,000 tons (a 2.0-fold increase) or $770 mn (a 1.96-fold increase) and the share, to 4.7% (+2.2 p.p.).
- Growth in volumes of nickel supplies to 8.400 tons (+75%) failed to overcome price effects and, consequently, the value decreased to $130 mn (-12.0%) and the market share remained at the level of 2.0%.
The recent expansion of restrictions on Russian metals supplies to the US market is expected to lead to a short-term price volatility and greater concentration of supplies to neutral countries’ markets.
- China’s imports of wood and wood products from Russia were stable: 3.27 mn tons (+3%) or $1.25 bn (-4.7%), with the share still at 11.2% (-0.5 p.p.).
- Supplies of chemical products to China increased to $1.13 bn (+17.6%).
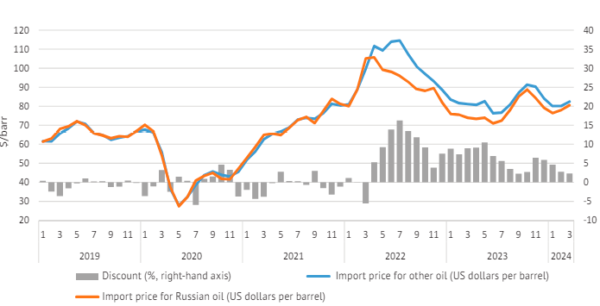
Discounts on Russian oil and LNG
From March 2022, Russia started to supply oil to China at a discount, which in the summer of 2022 was equal to 16% and at the end of the year decreased to 4–9%.
After the embargo on oil supplies to the EU was introduced, the discount increased again to 11% in May 2023. Then the discount on Russian oil began to decline, currently amounting to 2–5%, which can be explained by differences in the grades of oil supplied from Russia and other countries. Minor average price deviations took place before during periods of high oil price volatility and this can be explained by temporary unevenness in oil imports throughout a month.
Import price for Russian oil (US dollars per barrel)
Note that there was actually no discount to the price for Russian LNG on the Chinese market. On the contrary, prices for Russian LNG (TNVED 271111) have been higher than those for LNG supplies from other countries almost in all months since February 2022. This is probably related to the duration of supply contracts. In Q1 2024, prices for imports of Russian LNG (USD/t) were also 11% higher than those for LNG imports from other countries.
Supplies from China and secondary sanctions
In Q1 2024, the overall volumes of Chinese goods supplies to Russia were stable at the level of $24.4 bn (+2.6% relative to Q1 2023). However, the monthly dynamics were not uniform: if in January-February there was strong growth (+12.5%), in March, a marked decrease (-14.2%). However, such a decline is partly related to the overall cooling of Chinese exports in March (-7.6%).
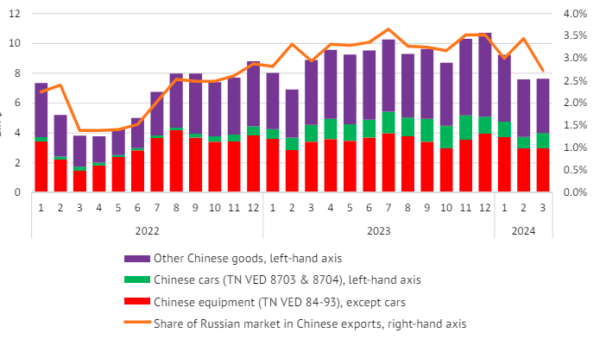
To take into account seasonality and the general dynamics of China’s exports, let’s consider the share of the Russian market in Chinese exports.
(China has floating holidays usually in February, while Russia’s share is traditionally lower in January owing to the longer New Year holidays)
In March, it fell sharply (a 1.25-fold decrease) to 2.73% (from 3.44% in February 2024), that is, the minimum value since December 2022.
The change in supply dynamics is most likely associated with the risks of secondary sanctions. This is pointed to by a more explicit decrease in the supply of equipment, which is more often affected by additional inspections. Indeed, after strong growth of 19.4% in January-February (on January-February 2023) the supplies of Chinese equipment in March declined sharply by 15.5% (on March 2023).
The change in the trend in supplies of other goods is less explicit: there was a transition from weaker growth in January-February (+3.5%) to a somewhat less marked decline in March (-12%).
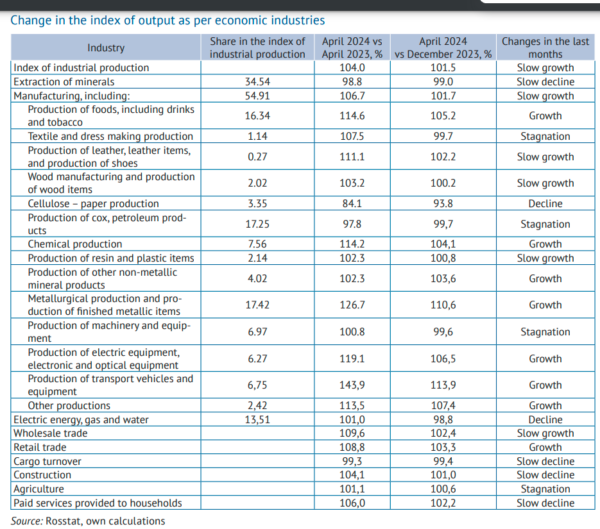
5. INDUSTRIAL PRODUCTION: IN JANUARY-APRIL 2024
In January-April 2024, the trend component of the industrial production index maintained growth, which was primarily secured by the manufacturing sector (the reason, among other factors, may be import substitution, including due to positive effect of production localization programs).
- The extractive sector continues a long downtrend.
- Production and distribution of electricity, gas and water in the period under review shows a slight decline.
In order to correctly interpret the available trends in individual industries, it’s necessary to decompose their output into components: calendar, seasonal, irregular and trend ones. The interpretation of the latter is of substantial interest.
Trend component of the industrial production in January-April 2024 demonstrated growth (109.8% compared to January-April 2023):
- Manufacturing sector positively contributed to dynamics
- Slowdown was observed in the extractive industry and in the production and distribution of electric energy, gas and water
Trade restrictions and prolongation of the OPEC+ agreement continue to negatively impact on the dynamics of the volumes of production in the extractive sector. Suspension of the publication on statistics on volumes of the oil extraction was prolonged by the Government of the Russian Federation until April 1, 2025.
It was mentioned in the OPEC report published in May 2024 that average daily oil extraction in Russia in Q1 amounted to 9.4 mln barrel, which is lower by 16% compared to the similar period of the previous year (similar statistics was also presented by International Energy Agency).
Reduction in coal extraction in January-April 2024 follows the reduction
in external demand for Russian coal.
According to results of 2023, China, India and Turkey became main importers of Russian coal.
In Q1 2024, according to Center of price indexes (Gazprombank set up a pricing agency that, starting from September 2022, determines quotations for commodities in rubles, yuan, and other currencies of friendly countries, including quotations for Urals oil) the average monthly volume of imports to these countries has been totally reduced to these countries by 3mln tons compared to the similar index in 2023 (In 2023, average monthly coal imports to China, India and Turkey were 14 mln tons) which is associated with the reduction of competitiveness of the Russian coal:
- Due to low world prices (there is an excess of coal in the market, which compels Russian producers to secure discounts for their production among other things);
- Due to imposition of import duties in China (Indonesia and Australia have agreements on free trade and that is why they did not experience challenges);
- Third, due to reduction in demand from India because they increased their own extraction;
- Fourth, due to high tariffs for transshipment, which increase the already high transport losses (logistical restrictions at the Eastern range force to transport Russian coal products through ports in
the Azov-Black Sea basin and ports in the North-West. Many companies refuse to transship coal through the port in Taman
from the beginning of 2024, thereby affecting the reduction of exports to Turkey.)
After a decline in gas production in 2022–2023, the industry saw a positive trend in Q1 2024 mainly due to attractive prices. Growth in demand from the EU (via the Turkish Stream pipeline and through Ukraine), China (exports in 2024 via the Power of Siberia pipeline are forecasted at 30 bcm, up 7 bcm from 2023) and Uzbekistan, as well as growth in domestic demand (due to continuation of the domestic gasification program).
Growth of the manufacturing industry in January-April 2024, as well as in 2023, was mainly associated with the production of intermediate products for the defense industry and import substitution.
Since the beginning of 2024, production of motor vehicles and computers, electronic and optical products demonstrated high growth rates, which is associated with the low base of the previous year and, possibly, the positive effects of production localization programs (which, inter alia, creates a reserve for demand growth in the industries
producing components).
In other sectors of the economy (trade due to sale of non-food products,
including products of new foreign partners, construction due to restoration of infrastructure and housing construction, including growth of individual housing construction) in January-April 2024 growth of the trend component was observed, except for freight transportation (as in H2 2023 due to limitation of throughput capacity of railroads to the APR countries), agriculture and other paid services to households (due to the high base of the previous year).
According to analysis of dynamics of the production indexes in 2023, it was found that industries focused on external markets have suffered most of all due to imposed sanctions (extraction of oil and gas, production of petroleum products, wood processing), while restrictions in the industries focused on domestic consumption and production of intermediary products for defense industrial industry were not a deterring factor1.
The dynamics of trend components of the production indexes in January-April 2024 allows to suggest the industry capacity associated with entering niches in the domestic market by Russian producers followed by withdrawal of foreign producers, has not been fully implemented, which may allow to maintain positive growth rate.
6. S&P report on Russian Manufacturing
The Russian manufacturing sector continued to expand during June, according to latest PMI data from S&P Global.
Operating conditions improved at a strong rate, amid steep increases in output and new orders. Meanwhile, sustained demand conditions encouraged firms to take on additional staff, as employment rose at the fastest rate on record.
Companies also stepped up their input buying, as some looked to build safety stocks as business confidence ticked higher.
Cost pressures built amid higher logistics charges, with input prices rising at the fastest pace since November 2023.
Accommodative demand conditions allowed firms to raise their selling prices at a sharper rate. The seasonally adjusted S&P Global Russia Manufacturing Purchasing Managers’ Index (PMI) posted 54.9 in June, up from 54.4 in May.
The latest data signaled a strong upturn in the health of the Russian manufacturing sector, and one that was the fastest in three months.
Russian goods producers continued to register a sharp expansion in new orders midway through the year, with the pace of growth quickening. Panelists often stated that greater new sales were linked to sustained demand conditions and new client wins.
Moreover, foreign customer demand improved in June, as new
export orders returned to growth for the first time in three months.
Consequently, output levels at manufacturers grew.
Production rose at a steep pace amid a stronger expansion
in new orders. Moreover, the pace of increase in output was
among the fastest in seven-and-a-half years.
Supported by sustained demand for Russian goods,
manufacturers expanded their workforce numbers again
during June. The pace of job creation accelerated to the most
marked on record, as firms noted the hiring of largely full-time
workers and those to accommodate new shift patterns.
Employment growth was in part to alleviate pressure on
capacity, with manufacturers registering a renewed decline
in backlogs of work in June. The fall was the first in four
months and modest overall.
Ongoing logistics issues and higher transportation and supplier prices reportedly drove cost inflation midway through 2024. Input prices rose at the sharpest rate since November 2023, with substantial increases in operating expenses.
Sustained demand conditions allowed firms to pass-through a greater proportion of the rise in input costs to customers in June, as selling prices increased markedly. The rate of charge inflation quickened for the third month running and was the steepest in 2024 to date.
Meanwhile, input buying increased at the fastest pace for six months in June. Greater new orders and efforts to replenish used stocks reportedly supported the steeper upturn. The pace of growth was well above the long-run series average.
Despite efforts to rebuild stocks, both pre- and postproduction inventories declined at the end of the second quarter. Stocks of finished goods contracted at the quickest rate in four months, as current holdings of items were used to fulfil orders.
Finally, Russian manufacturers were confident of an increase in output over the coming year, as the degree of confidence reached the highest in three months. Companies were buoyed by planned investment
7. BRICS
The intention of over twenty countries to join BRICS is the evidence of high political authority of the “group of five” which constantly upholds the formation of “a flexible, effective, efficient, representative, democratic and accountable international and multilateral system.”
This trend is closely associated with de-Westernization processes in societies and policies of global South countries and their growing pursuit of autonomy and freedom in determining their own policy and priorities (after 2020 and particularly in 2022).
Though BRICS has declared its intentions for reforming, rather than establishing an alternative global governance system, numerous countries regard BRICS as critical in the forefront of “de-Westernization.”
The decision on joining BRICS by the Arab Republic of Egypt, the Islamic Republic of Iran, the United Arab Emirates, the Kingdom of Saudi Arabia and the Federative Democratic Republic of Ethiopia has strengthened the share of GDP of the enlarged BRICS based on purchasing power parity is equal to 36.9% and the share of the population, to 46.7% of the global one (compared to the G7 countries’ 29.95%2 and 8.61%3, respectively). At the same time, the gap between the level of representativeness and the ability to influence decision-making in the IMF has widened.
Thus, even after the expansion, the BRICS collective share of quotas and votes in the IMF will be equal to 19.32% and 18.57%, respectively, compared to the collective G7 share of 43.36% and 41.4%, respectively.
Overall, this creates additional grounds for a more active position of BRICS on reforms and strengthening of the international financial architecture (IFA). And it concerns not only the Bretton Woods
institutions, but also all components of the existing system, including global and regional financial safety nets, sovereign borrowing and debt mechanisms, multilateral development banks, financial market regulation and the financial and payment infrastructure.
BRICS faces a serious task of integrating new members into existing cooperation mechanisms. Expansion will pose a challenge to the group’s internal unity. Added to territorial disputes and differences between China and India are the conflicts between Egypt and Ethiopia over water resources (the Blue Nile) and competition for intraregional influence between the countries of the Middle East.
It is necessary to define the parameters for new BRICS members’ accession to the New Development Bank (NDB), including the size of quotas and allocated capital and the nature of participation in the management of the bank, with taking into account the fact that according to Article 6a of the Agreement on the NDB the number of votes of a shareholder is equal to its share in the bank’s allocated capital.
At the same time, in accordance with Article 8c changes in the subscribed capital cannot lead to a decrease below 55% in the share of the founders of the bank and to an increase above 7% in the share of votes of a non-founder member.
It is obvious that new members will be claiming participation in the management of the bank, and a decision will have to be made regarding Article 13c under which each founding country is represented by at least one vice-president, except for a country represented by the president.
Enlargement is unlikely to make it easier for BRICS to agree on a single settlement unit within the group. For many years, the idea of creating a single BRICS currency has been debated at the expert and working level.
This issue was not reflected in official documents. At the same time, the BRICS countries have noted the need to use national currencies in trade and investment since 2015.
In 2023, Brazilian President Lula da Silva raised the issue of creating a single settlement unit to the political level. The Johannesburg summit emphasized the need to encourage the use of national currencies in international trade and financial transactions between the BRICS countries and their trading partners, as well as cooperation on
the payment infrastructure to facilitate trade and investment flows. The leaders instructed finance ministers and central bank governors of the BRICS countries to consider the use of national currencies, payment instruments and platforms and report on the results at the next summit.
A single currency is not mentioned in the order, probably, because of India’ opposition to this idea. However, there is still a chance that debates will begin on possibilities and practical steps to create a single BRICS settlement unit which would be instrumental in solving
the issue of bilateral trade surpluses in national currencies.

Specific proposals for the implementation of the idea, including the creation of an “issuing bank” and the provision of securities guaranteed by member countries, were formulated by Paulo Nogueira Batista, Brazilian economist and former NDB vice-president.
The settlement unit can be formed by analogy with the special drawing rights on the basis of a basket of national currencies, reflecting the relative economic weight of the member countries’ economies.
At the first stage, it could function as a digital unit of denomination for government transactions and official accounting, as well as for replacing the US Dollar in the NDB’s internal accounting and the Contingent
Reserve Arrangement. With a single settlement unit available, countries with a trade surplus would be able to use it in bilateral transactions with other member countries. The NDB could promote dedollarization by accelerating the use of the new settlement unit in its loans and other financial transactions, as well as in issuing of securities.
The implementation of the initiative could become an important contribution of BRICS to the reform and democratization of the international financial system. It undoubtedly meets Russia’s priorities in ensuring economic security, economic sovereignty, sustainable economic growth and a higher international competitiveness of the national economy.
Probably, at the first stage not all BRICS members would like or be able to join the mechanism. One should be prepared that this movement will take place at different speeds. Given the commitment of Brazil’s leaders to this idea, there is a chance of launching the mechanism in the
next two years.
BRICS has entered a new stage of development and its efficiency
will depend in particular on the quality of cooperation within the framework of Russia’s BRICS chairmanship in 2024.
8. World Bank report on Russian household wealth
The World Bank’s annual national income rankings reported that Russia has advanced from “upper middle” to “high” category on the strength of its economic growth.
The bank measures gross national income (GNI) based on a method dating back to 1989, and updates its classifications every July 1, based on the previous calendar year’s GNI per capita. The income is measured in the equivalent of US dollars.
“Economic activity in Russia was influenced by a large increase in military related activity in 2023, while growth was also boosted by a rebound in trade (+6.8%), the financial sector (+8.7%), and construction (+6.6%)…These factors led to increases in both real (3.6%) and nominal (10.9%) GDP, and Russia’s Atlas GNI per capita grew by 11.2%”.
To be considered high-income, a country has to have a GNI of over $14,005, adjusted up from $13,845 for the previous fiscal year. The adjustment relies on a weighted average of GDP deflators of China, Japan, the UK, the US, and the Eurozone.
The income classification is supposed to reflect a country’s level of development, using the GNI as “broadly available indicator of economic capacity.”
World Bank figures also showed a trend towards development in South Asia and Latin America and the Caribbean, while the Middle East and North Africa were worse off in 2023 than in 1987. By contrast, Europe and Central Asia went from having 71% of high-income countries in 1987 to 69% in the past fiscal year.
The end?